Laotian vs Puget Sound Salish Master's Degree
COMPARE
Laotian
Puget Sound Salish
Master's Degree
Master's Degree Comparison
Laotians
Puget Sound Salish
17.0%
MASTER'S DEGREE
98.8/ 100
METRIC RATING
99th/ 347
METRIC RANK
11.1%
MASTER'S DEGREE
0.0/ 100
METRIC RATING
309th/ 347
METRIC RANK
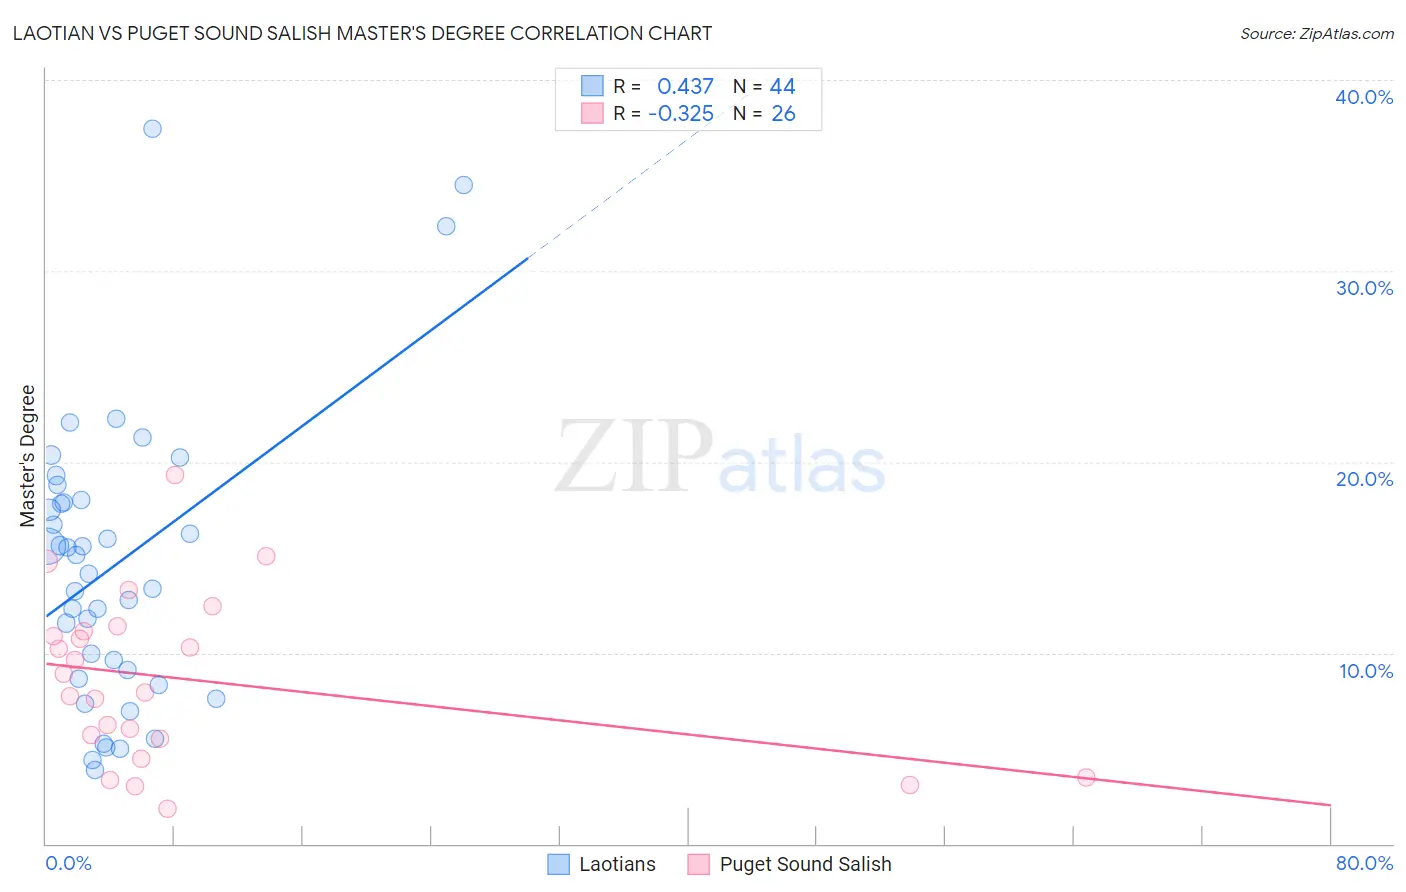
Laotian vs Puget Sound Salish Master's Degree Correlation Chart
The statistical analysis conducted on geographies consisting of 224,808,170 people shows a moderate positive correlation between the proportion of Laotians and percentage of population with at least master's degree education in the United States with a correlation coefficient (R) of 0.437 and weighted average of 17.0%. Similarly, the statistical analysis conducted on geographies consisting of 46,155,292 people shows a mild negative correlation between the proportion of Puget Sound Salish and percentage of population with at least master's degree education in the United States with a correlation coefficient (R) of -0.325 and weighted average of 11.1%, a difference of 52.8%.
Master's Degree Correlation Summary
| Measurement | Laotian | Puget Sound Salish |
| Minimum | 3.9% | 1.9% |
| Maximum | 37.4% | 19.3% |
| Range | 33.6% | 17.5% |
| Mean | 14.6% | 8.6% |
| Median | 14.6% | 8.4% |
| Interquartile 25% (IQ1) | 8.9% | 5.5% |
| Interquartile 75% (IQ3) | 17.9% | 11.1% |
| Interquartile Range (IQR) | 9.1% | 5.6% |
| Standard Deviation (Sample) | 7.6% | 4.4% |
| Standard Deviation (Population) | 7.5% | 4.3% |
Similar Demographics by Master's Degree
Demographics Similar to Laotians by Master's Degree
In terms of master's degree, the demographic groups most similar to Laotians are Immigrants from Ukraine (17.0%, a difference of 0.060%), Immigrants from England (17.0%, a difference of 0.15%), Albanian (17.0%, a difference of 0.21%), Immigrants from Northern Africa (17.1%, a difference of 0.32%), and Immigrants from Morocco (17.1%, a difference of 0.35%).
| Demographics | Rating | Rank | Master's Degree |
| Immigrants | North America | 99.1 /100 | #92 | Exceptional 17.2% |
| Immigrants | Italy | 99.1 /100 | #93 | Exceptional 17.2% |
| Ugandans | 99.0 /100 | #94 | Exceptional 17.1% |
| Immigrants | Morocco | 98.9 /100 | #95 | Exceptional 17.1% |
| Immigrants | Northern Africa | 98.9 /100 | #96 | Exceptional 17.1% |
| Immigrants | England | 98.8 /100 | #97 | Exceptional 17.0% |
| Immigrants | Ukraine | 98.8 /100 | #98 | Exceptional 17.0% |
| Laotians | 98.8 /100 | #99 | Exceptional 17.0% |
| Albanians | 98.7 /100 | #100 | Exceptional 17.0% |
| Immigrants | Nepal | 98.6 /100 | #101 | Exceptional 17.0% |
| Chileans | 98.6 /100 | #102 | Exceptional 16.9% |
| Alsatians | 98.4 /100 | #103 | Exceptional 16.9% |
| Ukrainians | 98.3 /100 | #104 | Exceptional 16.9% |
| Syrians | 98.3 /100 | #105 | Exceptional 16.8% |
| Immigrants | Albania | 98.1 /100 | #106 | Exceptional 16.8% |
Demographics Similar to Puget Sound Salish by Master's Degree
In terms of master's degree, the demographic groups most similar to Puget Sound Salish are Puerto Rican (11.2%, a difference of 0.29%), Shoshone (11.1%, a difference of 0.36%), Cheyenne (11.2%, a difference of 0.84%), Seminole (11.0%, a difference of 0.87%), and Choctaw (11.0%, a difference of 0.97%).
| Demographics | Rating | Rank | Master's Degree |
| Cherokee | 0.1 /100 | #302 | Tragic 11.4% |
| Immigrants | Laos | 0.1 /100 | #303 | Tragic 11.4% |
| Immigrants | Cabo Verde | 0.1 /100 | #304 | Tragic 11.3% |
| Immigrants | Latin America | 0.0 /100 | #305 | Tragic 11.3% |
| Mexican American Indians | 0.0 /100 | #306 | Tragic 11.2% |
| Cheyenne | 0.0 /100 | #307 | Tragic 11.2% |
| Puerto Ricans | 0.0 /100 | #308 | Tragic 11.2% |
| Puget Sound Salish | 0.0 /100 | #309 | Tragic 11.1% |
| Shoshone | 0.0 /100 | #310 | Tragic 11.1% |
| Seminole | 0.0 /100 | #311 | Tragic 11.0% |
| Choctaw | 0.0 /100 | #312 | Tragic 11.0% |
| Yaqui | 0.0 /100 | #313 | Tragic 11.0% |
| Cajuns | 0.0 /100 | #314 | Tragic 11.0% |
| Apache | 0.0 /100 | #315 | Tragic 11.0% |
| Hispanics or Latinos | 0.0 /100 | #316 | Tragic 10.9% |