Korean vs Immigrants from South Eastern Asia Kindergarten
COMPARE
Korean
Immigrants from South Eastern Asia
Kindergarten
Kindergarten Comparison
Koreans
Immigrants from South Eastern Asia
97.6%
KINDERGARTEN
1.6/ 100
METRIC RATING
240th/ 347
METRIC RANK
97.1%
KINDERGARTEN
0.0/ 100
METRIC RATING
301st/ 347
METRIC RANK
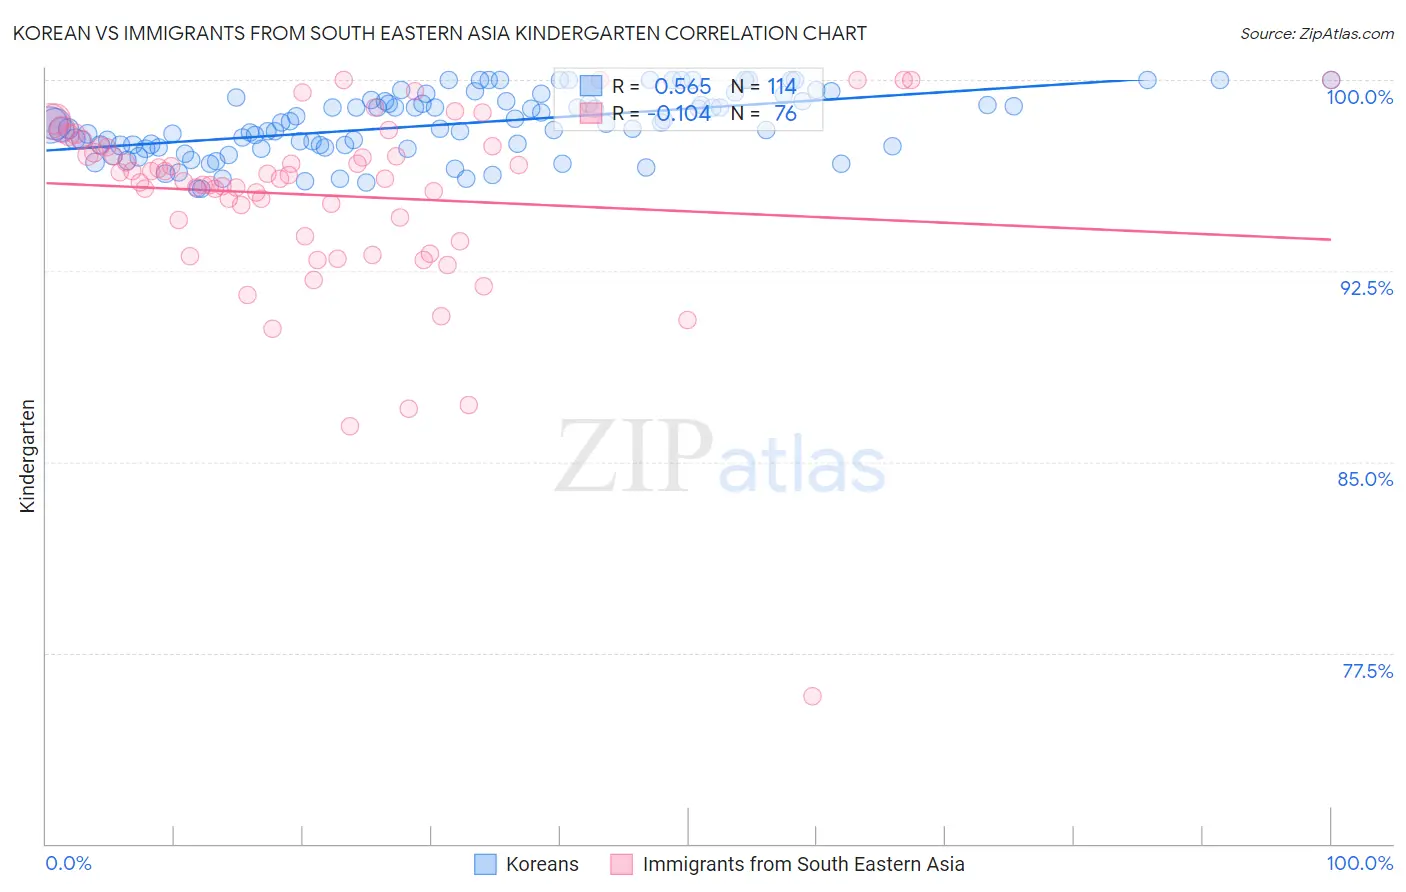
Korean vs Immigrants from South Eastern Asia Kindergarten Correlation Chart
The statistical analysis conducted on geographies consisting of 510,935,951 people shows a substantial positive correlation between the proportion of Koreans and percentage of population with at least kindergarten education in the United States with a correlation coefficient (R) of 0.565 and weighted average of 97.6%. Similarly, the statistical analysis conducted on geographies consisting of 512,710,277 people shows a poor negative correlation between the proportion of Immigrants from South Eastern Asia and percentage of population with at least kindergarten education in the United States with a correlation coefficient (R) of -0.104 and weighted average of 97.1%, a difference of 0.55%.
Kindergarten Correlation Summary
| Measurement | Korean | Immigrants from South Eastern Asia |
| Minimum | 95.7% | 75.8% |
| Maximum | 100.0% | 100.0% |
| Range | 4.3% | 24.2% |
| Mean | 98.2% | 95.5% |
| Median | 98.2% | 96.2% |
| Interquartile 25% (IQ1) | 97.4% | 94.2% |
| Interquartile 75% (IQ3) | 99.2% | 97.4% |
| Interquartile Range (IQR) | 1.8% | 3.2% |
| Standard Deviation (Sample) | 1.2% | 3.7% |
| Standard Deviation (Population) | 1.2% | 3.7% |
Similar Demographics by Kindergarten
Demographics Similar to Koreans by Kindergarten
In terms of kindergarten, the demographic groups most similar to Koreans are Nigerian (97.6%, a difference of 0.010%), Immigrants from Eastern Asia (97.6%, a difference of 0.010%), U.S. Virgin Islander (97.6%, a difference of 0.010%), Immigrants from Malaysia (97.7%, a difference of 0.020%), and Colombian (97.7%, a difference of 0.020%).
| Demographics | Rating | Rank | Kindergarten |
| Immigrants | Pakistan | 2.2 /100 | #233 | Tragic 97.7% |
| Immigrants | Malaysia | 2.2 /100 | #234 | Tragic 97.7% |
| Colombians | 2.2 /100 | #235 | Tragic 97.7% |
| Immigrants | Western Asia | 2.1 /100 | #236 | Tragic 97.7% |
| Nigerians | 1.8 /100 | #237 | Tragic 97.6% |
| Immigrants | Eastern Asia | 1.7 /100 | #238 | Tragic 97.6% |
| U.S. Virgin Islanders | 1.7 /100 | #239 | Tragic 97.6% |
| Koreans | 1.6 /100 | #240 | Tragic 97.6% |
| Liberians | 1.3 /100 | #241 | Tragic 97.6% |
| Immigrants | Indonesia | 1.3 /100 | #242 | Tragic 97.6% |
| Asians | 1.2 /100 | #243 | Tragic 97.6% |
| Bolivians | 1.2 /100 | #244 | Tragic 97.6% |
| South Americans | 1.1 /100 | #245 | Tragic 97.6% |
| Indians (Asian) | 1.0 /100 | #246 | Tragic 97.6% |
| Immigrants | Eastern Africa | 1.0 /100 | #247 | Tragic 97.6% |
Demographics Similar to Immigrants from South Eastern Asia by Kindergarten
In terms of kindergarten, the demographic groups most similar to Immigrants from South Eastern Asia are Haitian (97.1%, a difference of 0.020%), Immigrants from Cuba (97.1%, a difference of 0.030%), Immigrants from Caribbean (97.1%, a difference of 0.030%), Immigrants from Dominica (97.1%, a difference of 0.040%), and Central American Indian (97.2%, a difference of 0.050%).
| Demographics | Rating | Rank | Kindergarten |
| Immigrants | Immigrants | 0.0 /100 | #294 | Tragic 97.2% |
| Immigrants | Grenada | 0.0 /100 | #295 | Tragic 97.2% |
| Immigrants | Eritrea | 0.0 /100 | #296 | Tragic 97.2% |
| Central American Indians | 0.0 /100 | #297 | Tragic 97.2% |
| Immigrants | Dominica | 0.0 /100 | #298 | Tragic 97.1% |
| Immigrants | Cuba | 0.0 /100 | #299 | Tragic 97.1% |
| Haitians | 0.0 /100 | #300 | Tragic 97.1% |
| Immigrants | South Eastern Asia | 0.0 /100 | #301 | Tragic 97.1% |
| Immigrants | Caribbean | 0.0 /100 | #302 | Tragic 97.1% |
| Somalis | 0.0 /100 | #303 | Tragic 97.0% |
| Nicaraguans | 0.0 /100 | #304 | Tragic 97.0% |
| Ecuadorians | 0.0 /100 | #305 | Tragic 97.0% |
| Belizeans | 0.0 /100 | #306 | Tragic 97.0% |
| Hispanics or Latinos | 0.0 /100 | #307 | Tragic 97.0% |
| Immigrants | Somalia | 0.0 /100 | #308 | Tragic 97.0% |