Kiowa vs Immigrants from Lithuania College, Under 1 year
COMPARE
Kiowa
Immigrants from Lithuania
College, Under 1 year
College, Under 1 year Comparison
Kiowa
Immigrants from Lithuania
57.8%
COLLEGE, UNDER 1 YEAR
0.0/ 100
METRIC RATING
304th/ 347
METRIC RANK
70.3%
COLLEGE, UNDER 1 YEAR
99.9/ 100
METRIC RATING
42nd/ 347
METRIC RANK
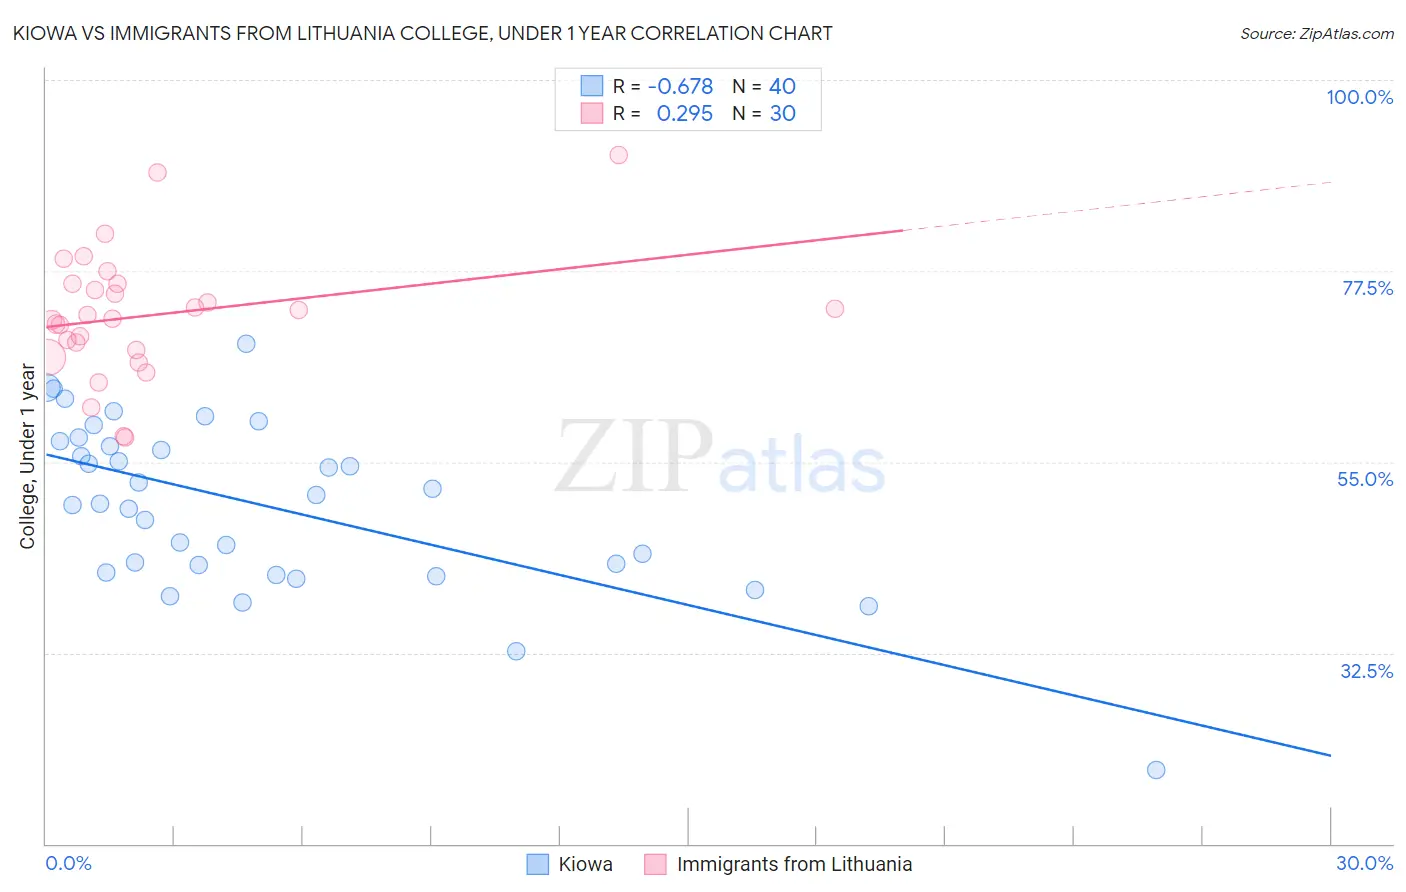
Kiowa vs Immigrants from Lithuania College, Under 1 year Correlation Chart
The statistical analysis conducted on geographies consisting of 56,101,444 people shows a significant negative correlation between the proportion of Kiowa and percentage of population with at least college, under 1 year education in the United States with a correlation coefficient (R) of -0.678 and weighted average of 57.8%. Similarly, the statistical analysis conducted on geographies consisting of 117,724,932 people shows a weak positive correlation between the proportion of Immigrants from Lithuania and percentage of population with at least college, under 1 year education in the United States with a correlation coefficient (R) of 0.295 and weighted average of 70.3%, a difference of 21.5%.
College, Under 1 year Correlation Summary
| Measurement | Kiowa | Immigrants from Lithuania |
| Minimum | 18.8% | 57.9% |
| Maximum | 68.9% | 91.2% |
| Range | 50.2% | 33.3% |
| Mean | 49.8% | 72.3% |
| Median | 50.6% | 72.1% |
| Interquartile 25% (IQ1) | 42.4% | 68.2% |
| Interquartile 75% (IQ3) | 57.2% | 76.0% |
| Interquartile Range (IQR) | 14.8% | 7.8% |
| Standard Deviation (Sample) | 10.0% | 7.5% |
| Standard Deviation (Population) | 9.9% | 7.4% |
Similar Demographics by College, Under 1 year
Demographics Similar to Kiowa by College, Under 1 year
In terms of college, under 1 year, the demographic groups most similar to Kiowa are Immigrants from Dominica (57.9%, a difference of 0.010%), Haitian (57.8%, a difference of 0.11%), Apache (58.0%, a difference of 0.30%), Immigrants from Portugal (57.7%, a difference of 0.31%), and Fijian (57.7%, a difference of 0.32%).
| Demographics | Rating | Rank | College, Under 1 year |
| Guyanese | 0.0 /100 | #297 | Tragic 59.0% |
| Immigrants | Ecuador | 0.0 /100 | #298 | Tragic 58.7% |
| Cubans | 0.0 /100 | #299 | Tragic 58.6% |
| Immigrants | Guyana | 0.0 /100 | #300 | Tragic 58.5% |
| Mexican American Indians | 0.0 /100 | #301 | Tragic 58.1% |
| Apache | 0.0 /100 | #302 | Tragic 58.0% |
| Immigrants | Dominica | 0.0 /100 | #303 | Tragic 57.9% |
| Kiowa | 0.0 /100 | #304 | Tragic 57.8% |
| Haitians | 0.0 /100 | #305 | Tragic 57.8% |
| Immigrants | Portugal | 0.0 /100 | #306 | Tragic 57.7% |
| Fijians | 0.0 /100 | #307 | Tragic 57.7% |
| Central Americans | 0.0 /100 | #308 | Tragic 57.7% |
| Immigrants | Nicaragua | 0.0 /100 | #309 | Tragic 57.6% |
| Pueblo | 0.0 /100 | #310 | Tragic 57.4% |
| Cajuns | 0.0 /100 | #311 | Tragic 57.3% |
Demographics Similar to Immigrants from Lithuania by College, Under 1 year
In terms of college, under 1 year, the demographic groups most similar to Immigrants from Lithuania are Immigrants from Kuwait (70.3%, a difference of 0.050%), Israeli (70.2%, a difference of 0.070%), New Zealander (70.2%, a difference of 0.070%), Immigrants from Turkey (70.3%, a difference of 0.090%), and Immigrants from Norway (70.2%, a difference of 0.090%).
| Demographics | Rating | Rank | College, Under 1 year |
| Russians | 99.9 /100 | #35 | Exceptional 70.5% |
| Immigrants | Sri Lanka | 99.9 /100 | #36 | Exceptional 70.5% |
| Immigrants | Saudi Arabia | 99.9 /100 | #37 | Exceptional 70.4% |
| Australians | 99.9 /100 | #38 | Exceptional 70.4% |
| Bhutanese | 99.9 /100 | #39 | Exceptional 70.3% |
| Immigrants | Turkey | 99.9 /100 | #40 | Exceptional 70.3% |
| Immigrants | Kuwait | 99.9 /100 | #41 | Exceptional 70.3% |
| Immigrants | Lithuania | 99.9 /100 | #42 | Exceptional 70.3% |
| Israelis | 99.9 /100 | #43 | Exceptional 70.2% |
| New Zealanders | 99.9 /100 | #44 | Exceptional 70.2% |
| Immigrants | Norway | 99.9 /100 | #45 | Exceptional 70.2% |
| Immigrants | Latvia | 99.9 /100 | #46 | Exceptional 70.1% |
| Immigrants | Bulgaria | 99.8 /100 | #47 | Exceptional 70.0% |
| Immigrants | Netherlands | 99.8 /100 | #48 | Exceptional 70.0% |
| Immigrants | Austria | 99.8 /100 | #49 | Exceptional 70.0% |