Kiowa vs Immigrants from Cambodia 5th Grade
COMPARE
Kiowa
Immigrants from Cambodia
5th Grade
5th Grade Comparison
Kiowa
Immigrants from Cambodia
97.9%
5TH GRADE
99.5/ 100
METRIC RATING
69th/ 347
METRIC RANK
95.5%
5TH GRADE
0.0/ 100
METRIC RATING
326th/ 347
METRIC RANK
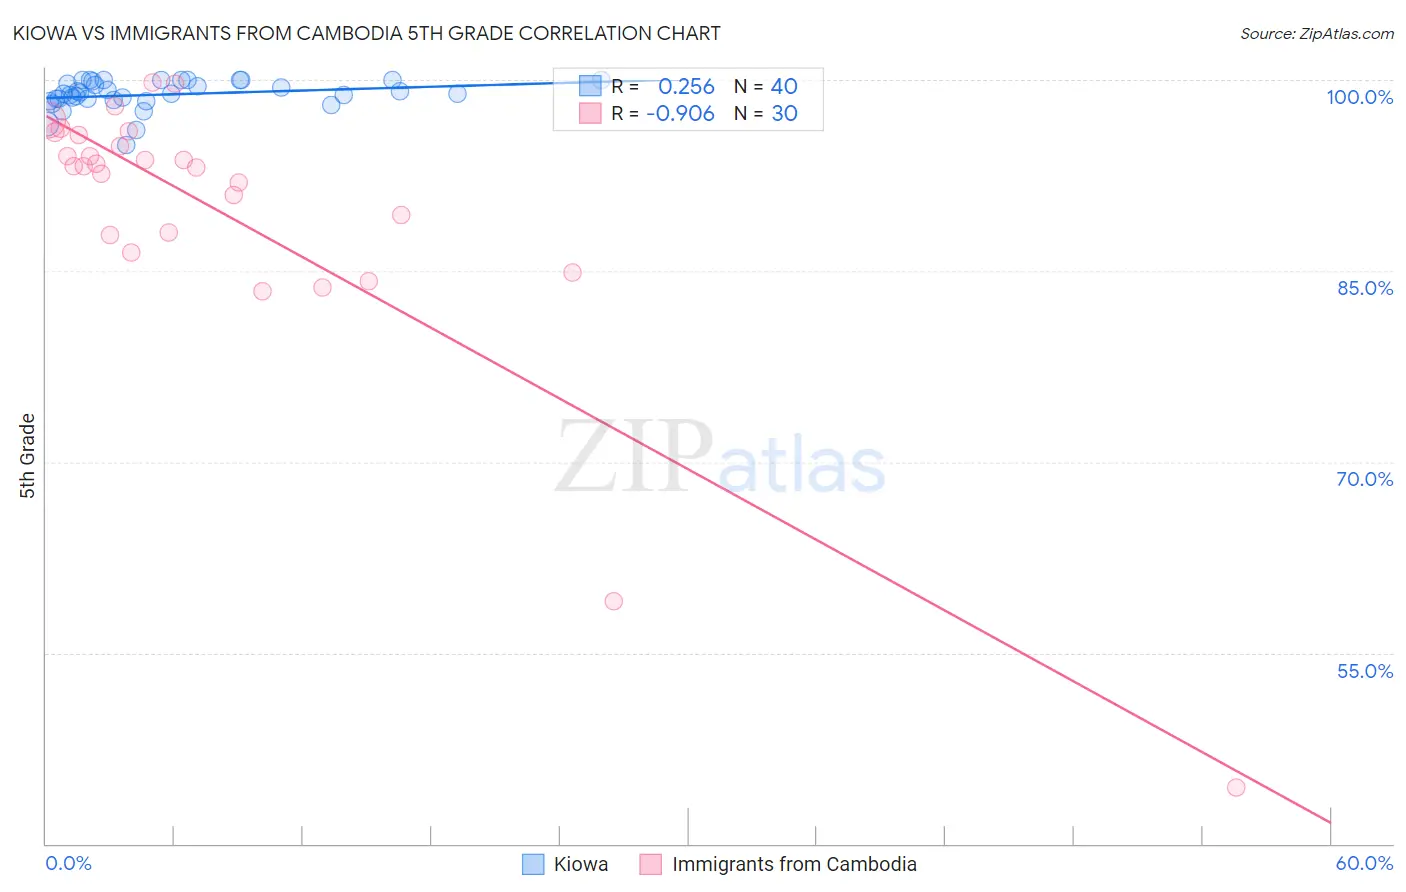
Kiowa vs Immigrants from Cambodia 5th Grade Correlation Chart
The statistical analysis conducted on geographies consisting of 56,100,633 people shows a weak positive correlation between the proportion of Kiowa and percentage of population with at least 5th grade education in the United States with a correlation coefficient (R) of 0.256 and weighted average of 97.9%. Similarly, the statistical analysis conducted on geographies consisting of 205,153,442 people shows a near-perfect negative correlation between the proportion of Immigrants from Cambodia and percentage of population with at least 5th grade education in the United States with a correlation coefficient (R) of -0.906 and weighted average of 95.5%, a difference of 2.4%.
5th Grade Correlation Summary
| Measurement | Kiowa | Immigrants from Cambodia |
| Minimum | 94.9% | 44.4% |
| Maximum | 100.0% | 99.8% |
| Range | 5.1% | 55.4% |
| Mean | 98.9% | 89.6% |
| Median | 98.9% | 93.3% |
| Interquartile 25% (IQ1) | 98.5% | 87.8% |
| Interquartile 75% (IQ3) | 99.9% | 95.7% |
| Interquartile Range (IQR) | 1.5% | 7.9% |
| Standard Deviation (Sample) | 1.1% | 11.4% |
| Standard Deviation (Population) | 1.1% | 11.2% |
Similar Demographics by 5th Grade
Demographics Similar to Kiowa by 5th Grade
In terms of 5th grade, the demographic groups most similar to Kiowa are Cajun (97.9%, a difference of 0.010%), Iranian (97.9%, a difference of 0.010%), Chickasaw (97.9%, a difference of 0.010%), Immigrants from Austria (97.9%, a difference of 0.020%), and New Zealander (97.9%, a difference of 0.020%).
| Demographics | Rating | Rank | 5th Grade |
| Immigrants | North America | 99.7 /100 | #62 | Exceptional 97.9% |
| Russians | 99.7 /100 | #63 | Exceptional 97.9% |
| Immigrants | Northern Europe | 99.6 /100 | #64 | Exceptional 97.9% |
| Canadians | 99.6 /100 | #65 | Exceptional 97.9% |
| Immigrants | Austria | 99.6 /100 | #66 | Exceptional 97.9% |
| New Zealanders | 99.6 /100 | #67 | Exceptional 97.9% |
| Cajuns | 99.6 /100 | #68 | Exceptional 97.9% |
| Kiowa | 99.5 /100 | #69 | Exceptional 97.9% |
| Iranians | 99.5 /100 | #70 | Exceptional 97.9% |
| Chickasaw | 99.5 /100 | #71 | Exceptional 97.9% |
| Macedonians | 99.4 /100 | #72 | Exceptional 97.9% |
| Cherokee | 99.4 /100 | #73 | Exceptional 97.8% |
| Lumbee | 99.3 /100 | #74 | Exceptional 97.8% |
| Ukrainians | 99.3 /100 | #75 | Exceptional 97.8% |
| Immigrants | Netherlands | 99.3 /100 | #76 | Exceptional 97.8% |
Demographics Similar to Immigrants from Cambodia by 5th Grade
In terms of 5th grade, the demographic groups most similar to Immigrants from Cambodia are Dominican (95.5%, a difference of 0.0%), Honduran (95.6%, a difference of 0.030%), Hispanic or Latino (95.6%, a difference of 0.030%), Cape Verdean (95.5%, a difference of 0.030%), and Mexican American Indian (95.5%, a difference of 0.040%).
| Demographics | Rating | Rank | 5th Grade |
| Japanese | 0.0 /100 | #319 | Tragic 95.7% |
| Central American Indians | 0.0 /100 | #320 | Tragic 95.7% |
| Immigrants | Belize | 0.0 /100 | #321 | Tragic 95.7% |
| Immigrants | Nicaragua | 0.0 /100 | #322 | Tragic 95.6% |
| Immigrants | Fiji | 0.0 /100 | #323 | Tragic 95.6% |
| Hondurans | 0.0 /100 | #324 | Tragic 95.6% |
| Hispanics or Latinos | 0.0 /100 | #325 | Tragic 95.6% |
| Immigrants | Cambodia | 0.0 /100 | #326 | Tragic 95.5% |
| Dominicans | 0.0 /100 | #327 | Tragic 95.5% |
| Cape Verdeans | 0.0 /100 | #328 | Tragic 95.5% |
| Mexican American Indians | 0.0 /100 | #329 | Tragic 95.5% |
| Immigrants | Armenia | 0.0 /100 | #330 | Tragic 95.4% |
| Immigrants | Honduras | 0.0 /100 | #331 | Tragic 95.4% |
| Immigrants | Dominican Republic | 0.0 /100 | #332 | Tragic 95.3% |
| Immigrants | Latin America | 0.0 /100 | #333 | Tragic 95.3% |