Kenyan vs Indonesian Doctorate Degree
COMPARE
Kenyan
Indonesian
Doctorate Degree
Doctorate Degree Comparison
Kenyans
Indonesians
1.9%
DOCTORATE DEGREE
83.6/ 100
METRIC RATING
145th/ 347
METRIC RANK
1.6%
DOCTORATE DEGREE
2.8/ 100
METRIC RATING
236th/ 347
METRIC RANK
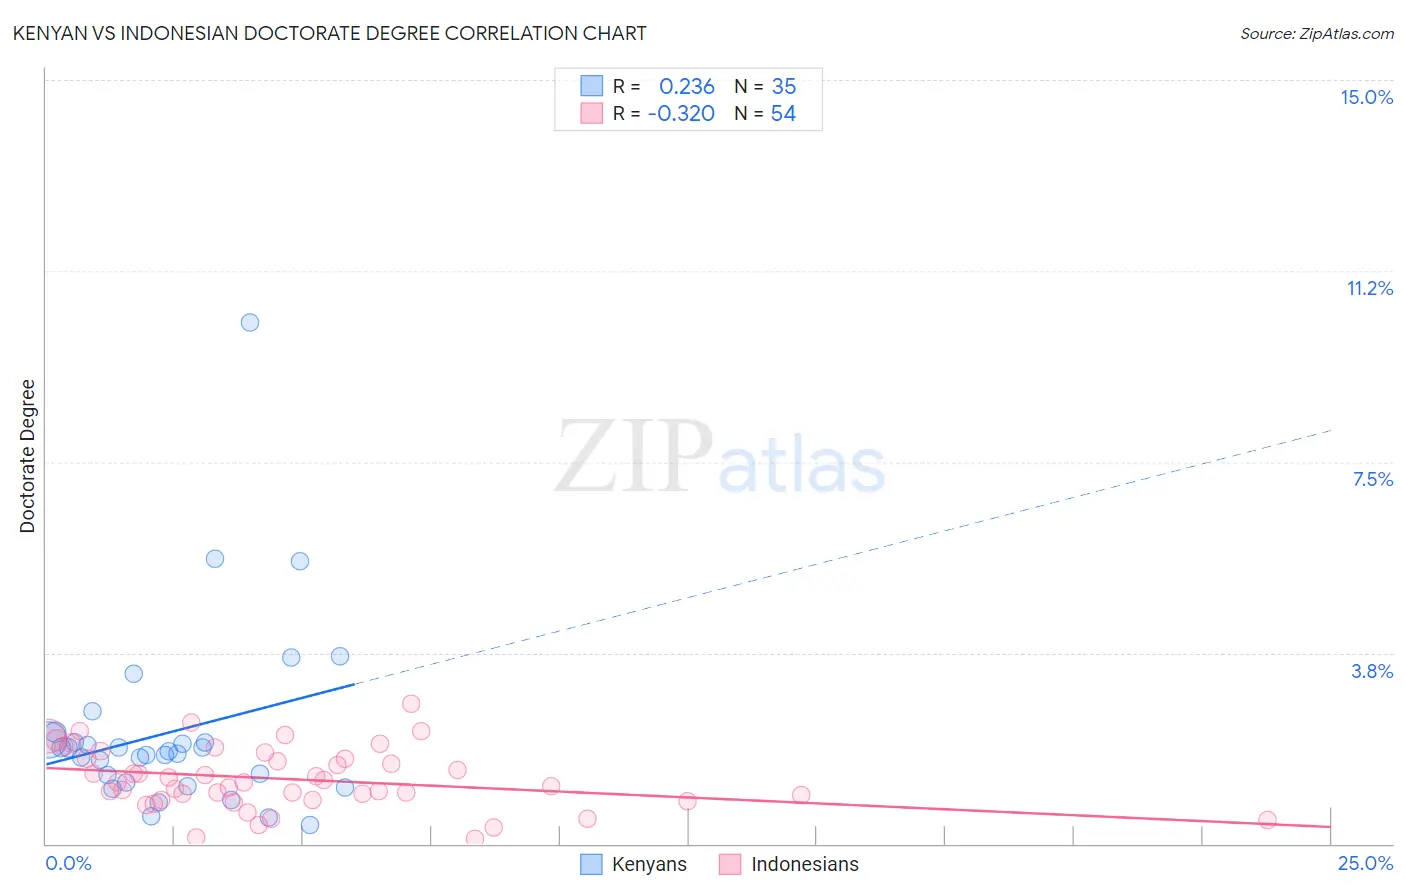
Kenyan vs Indonesian Doctorate Degree Correlation Chart
The statistical analysis conducted on geographies consisting of 167,867,619 people shows a weak positive correlation between the proportion of Kenyans and percentage of population with at least doctorate degree education in the United States with a correlation coefficient (R) of 0.236 and weighted average of 1.9%. Similarly, the statistical analysis conducted on geographies consisting of 162,227,737 people shows a mild negative correlation between the proportion of Indonesians and percentage of population with at least doctorate degree education in the United States with a correlation coefficient (R) of -0.320 and weighted average of 1.6%, a difference of 21.8%.
Doctorate Degree Correlation Summary
| Measurement | Kenyan | Indonesian |
| Minimum | 0.37% | 0.089% |
| Maximum | 10.2% | 2.7% |
| Range | 9.9% | 2.7% |
| Mean | 2.2% | 1.3% |
| Median | 1.8% | 1.2% |
| Interquartile 25% (IQ1) | 1.2% | 0.86% |
| Interquartile 75% (IQ3) | 2.0% | 1.7% |
| Interquartile Range (IQR) | 0.83% | 0.81% |
| Standard Deviation (Sample) | 1.8% | 0.60% |
| Standard Deviation (Population) | 1.8% | 0.59% |
Similar Demographics by Doctorate Degree
Demographics Similar to Kenyans by Doctorate Degree
In terms of doctorate degree, the demographic groups most similar to Kenyans are Immigrants from Syria (1.9%, a difference of 0.020%), Immigrants from Moldova (2.0%, a difference of 0.18%), Immigrants from Senegal (1.9%, a difference of 0.27%), Sierra Leonean (2.0%, a difference of 0.39%), and Luxembourger (1.9%, a difference of 0.60%).
| Demographics | Rating | Rank | Doctorate Degree |
| Swiss | 88.0 /100 | #138 | Excellent 2.0% |
| Afghans | 87.2 /100 | #139 | Excellent 2.0% |
| Immigrants | Africa | 87.0 /100 | #140 | Excellent 2.0% |
| Senegalese | 86.7 /100 | #141 | Excellent 2.0% |
| Italians | 86.0 /100 | #142 | Excellent 2.0% |
| Sierra Leoneans | 85.1 /100 | #143 | Excellent 2.0% |
| Immigrants | Moldova | 84.3 /100 | #144 | Excellent 2.0% |
| Kenyans | 83.6 /100 | #145 | Excellent 1.9% |
| Immigrants | Syria | 83.6 /100 | #146 | Excellent 1.9% |
| Immigrants | Senegal | 82.5 /100 | #147 | Excellent 1.9% |
| Luxembourgers | 81.1 /100 | #148 | Excellent 1.9% |
| Basques | 76.9 /100 | #149 | Good 1.9% |
| English | 75.9 /100 | #150 | Good 1.9% |
| Albanians | 74.8 /100 | #151 | Good 1.9% |
| Immigrants | Kenya | 74.3 /100 | #152 | Good 1.9% |
Demographics Similar to Indonesians by Doctorate Degree
In terms of doctorate degree, the demographic groups most similar to Indonesians are Iroquois (1.6%, a difference of 0.19%), Cree (1.6%, a difference of 0.29%), Immigrants from Congo (1.6%, a difference of 0.39%), Hopi (1.6%, a difference of 0.50%), and West Indian (1.6%, a difference of 0.50%).
| Demographics | Rating | Rank | Doctorate Degree |
| Colville | 4.7 /100 | #229 | Tragic 1.6% |
| Immigrants | Philippines | 4.3 /100 | #230 | Tragic 1.6% |
| Immigrants | North Macedonia | 3.9 /100 | #231 | Tragic 1.6% |
| Guamanians/Chamorros | 3.3 /100 | #232 | Tragic 1.6% |
| Barbadians | 3.3 /100 | #233 | Tragic 1.6% |
| Hopi | 3.2 /100 | #234 | Tragic 1.6% |
| Cree | 3.0 /100 | #235 | Tragic 1.6% |
| Indonesians | 2.8 /100 | #236 | Tragic 1.6% |
| Iroquois | 2.7 /100 | #237 | Tragic 1.6% |
| Immigrants | Congo | 2.6 /100 | #238 | Tragic 1.6% |
| West Indians | 2.5 /100 | #239 | Tragic 1.6% |
| Immigrants | Panama | 2.4 /100 | #240 | Tragic 1.6% |
| Cheyenne | 2.3 /100 | #241 | Tragic 1.6% |
| Ottawa | 2.2 /100 | #242 | Tragic 1.6% |
| Native Hawaiians | 2.1 /100 | #243 | Tragic 1.6% |