Jordanian vs Russian Associate's Degree
COMPARE
Jordanian
Russian
Associate's Degree
Associate's Degree Comparison
Jordanians
Russians
49.2%
ASSOCIATE'S DEGREE
96.6/ 100
METRIC RATING
108th/ 347
METRIC RANK
53.2%
ASSOCIATE'S DEGREE
100.0/ 100
METRIC RATING
35th/ 347
METRIC RANK
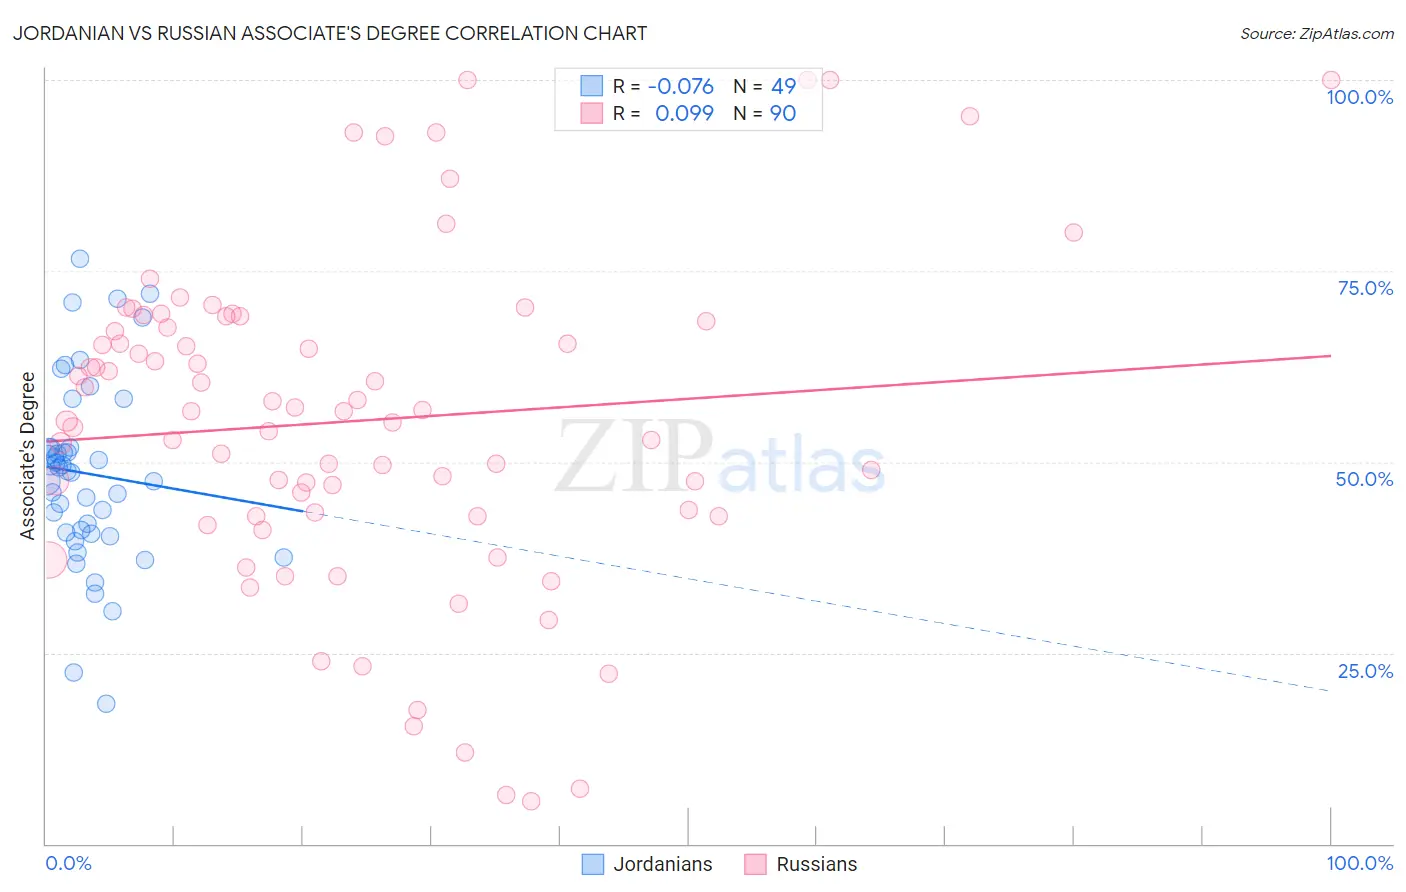
Jordanian vs Russian Associate's Degree Correlation Chart
The statistical analysis conducted on geographies consisting of 166,424,117 people shows a slight negative correlation between the proportion of Jordanians and percentage of population with at least associate's degree education in the United States with a correlation coefficient (R) of -0.076 and weighted average of 49.2%. Similarly, the statistical analysis conducted on geographies consisting of 512,209,602 people shows a slight positive correlation between the proportion of Russians and percentage of population with at least associate's degree education in the United States with a correlation coefficient (R) of 0.099 and weighted average of 53.2%, a difference of 8.1%.
Associate's Degree Correlation Summary
| Measurement | Jordanian | Russian |
| Minimum | 18.4% | 5.6% |
| Maximum | 76.6% | 100.0% |
| Range | 58.2% | 94.4% |
| Mean | 48.5% | 55.4% |
| Median | 48.8% | 56.6% |
| Interquartile 25% (IQ1) | 40.7% | 42.9% |
| Interquartile 75% (IQ3) | 51.9% | 68.4% |
| Interquartile Range (IQR) | 11.1% | 25.5% |
| Standard Deviation (Sample) | 12.2% | 21.5% |
| Standard Deviation (Population) | 12.0% | 21.3% |
Similar Demographics by Associate's Degree
Demographics Similar to Jordanians by Associate's Degree
In terms of associate's degree, the demographic groups most similar to Jordanians are Syrian (49.3%, a difference of 0.060%), Immigrants from Italy (49.3%, a difference of 0.090%), Croatian (49.3%, a difference of 0.10%), Immigrants from Morocco (49.2%, a difference of 0.13%), and Venezuelan (49.4%, a difference of 0.24%).
| Demographics | Rating | Rank | Associate's Degree |
| Northern Europeans | 97.3 /100 | #101 | Exceptional 49.5% |
| Chileans | 97.3 /100 | #102 | Exceptional 49.4% |
| Ukrainians | 97.1 /100 | #103 | Exceptional 49.4% |
| Venezuelans | 97.0 /100 | #104 | Exceptional 49.4% |
| Croatians | 96.8 /100 | #105 | Exceptional 49.3% |
| Immigrants | Italy | 96.7 /100 | #106 | Exceptional 49.3% |
| Syrians | 96.7 /100 | #107 | Exceptional 49.3% |
| Jordanians | 96.6 /100 | #108 | Exceptional 49.2% |
| Immigrants | Morocco | 96.3 /100 | #109 | Exceptional 49.2% |
| Austrians | 95.8 /100 | #110 | Exceptional 49.1% |
| Immigrants | Venezuela | 95.8 /100 | #111 | Exceptional 49.1% |
| Immigrants | Chile | 95.3 /100 | #112 | Exceptional 49.0% |
| Palestinians | 95.3 /100 | #113 | Exceptional 49.0% |
| Arabs | 95.3 /100 | #114 | Exceptional 49.0% |
| Luxembourgers | 95.1 /100 | #115 | Exceptional 48.9% |
Demographics Similar to Russians by Associate's Degree
In terms of associate's degree, the demographic groups most similar to Russians are Bulgarian (53.3%, a difference of 0.060%), Israeli (53.4%, a difference of 0.26%), Immigrants from Russia (53.1%, a difference of 0.28%), Immigrants from Denmark (53.1%, a difference of 0.36%), and Immigrants from Turkey (53.4%, a difference of 0.38%).
| Demographics | Rating | Rank | Associate's Degree |
| Turks | 100.0 /100 | #28 | Exceptional 53.9% |
| Immigrants | France | 100.0 /100 | #29 | Exceptional 53.9% |
| Immigrants | Sri Lanka | 100.0 /100 | #30 | Exceptional 53.7% |
| Immigrants | Northern Europe | 100.0 /100 | #31 | Exceptional 53.5% |
| Immigrants | Turkey | 100.0 /100 | #32 | Exceptional 53.4% |
| Israelis | 100.0 /100 | #33 | Exceptional 53.4% |
| Bulgarians | 100.0 /100 | #34 | Exceptional 53.3% |
| Russians | 100.0 /100 | #35 | Exceptional 53.2% |
| Immigrants | Russia | 100.0 /100 | #36 | Exceptional 53.1% |
| Immigrants | Denmark | 100.0 /100 | #37 | Exceptional 53.1% |
| Mongolians | 100.0 /100 | #38 | Exceptional 53.0% |
| Immigrants | Belarus | 99.9 /100 | #39 | Exceptional 52.8% |
| Immigrants | Latvia | 99.9 /100 | #40 | Exceptional 52.8% |
| Immigrants | Saudi Arabia | 99.9 /100 | #41 | Exceptional 52.6% |
| Immigrants | Malaysia | 99.9 /100 | #42 | Exceptional 52.5% |