Jordanian vs Marshallese 9th Grade

COMPARE

Jordanian
Race
Ancestry
AfghanAfricanAlaska NativeAlaskan AthabascanAlbanianAleutAlsatianAmericanApacheArabArapahoArgentineanArmenianAssyrian/Chaldean/SyriacAustralianAustrianBahamianBangladeshiBarbadianBasqueBelgianBelizeanBermudanBhutaneseBlackfeetBolivianBrazilianBritishBritish West IndianBulgarianBurmeseCajunCambodianCanadianCape VerdeanCarpatho RusynCelticCentral AmericanCentral American IndianCherokeeCheyenneChickasawChileanChineseChippewaChoctawColombianColvilleComancheCosta RicanCreeCreekCroatianCrowCubanCypriotCzechCzechoslovakianDanishDelawareDominicanDutchDutch West IndianEastern EuropeanEcuadorianEgyptianEnglishEstonianEthiopianEuropeanFijianFilipinoFinnishFrenchFrench American IndianFrench CanadianGermanGerman RussianGhanaianGreekGuamanian/ChamorroGuatemalanGuyaneseHaitianHmongHonduranHopiHoumaHungarianIcelanderIndian (Asian)IndonesianInupiatIranianIraqiIrishIroquoisIsraeliItalianJamaicanJapaneseJordanianKenyanKiowaKoreanLaotianLatvianLebaneseLiberianLithuanianLumbeeLuxembourgerMacedonianMalaysianMalteseMenomineeMexicanMexican American IndianMongolianMoroccanNative HawaiianNavajoNepaleseNew ZealanderNicaraguanNigerianNorthern EuropeanNorwegianOkinawanOsageOttawaPaiutePakistaniPalestinianPanamanianParaguayanPennsylvania GermanPeruvianPimaPolishPortuguesePotawatomiPuebloPuerto RicanPuget Sound SalishRomanianRussianSalvadoranSamoanScandinavianScotch-IrishScottishSeminoleSenegaleseSerbianShoshoneSierra LeoneanSiouxSlavicSlovakSloveneSomaliSouth AfricanSouth AmericanSouth American IndianSoviet UnionSpaniardSpanishSpanish AmericanSpanish American IndianSri LankanSubsaharan AfricanSudaneseSwedishSwissSyrianTaiwaneseThaiTlingit-HaidaTohono O'OdhamTonganTrinidadian and TobagonianTsimshianTurkishU.S. Virgin IslanderUgandanUkrainianUruguayanUteVenezuelanVietnameseWelshWest IndianYakamaYaquiYugoslavianYumanYup'ikZimbabwean
Immigration
NonimmigrantsImmigrantsAfghanistanAfricaAlbaniaArgentinaArmeniaAsiaAustraliaAustriaBahamasBangladeshBarbadosBelarusBelgiumBelizeBoliviaBosnia and HerzegovinaBrazilBulgariaBurma/MyanmarCabo VerdeCambodiaCameroonCanadaCaribbeanCentral AmericaChileChinaColombiaCongoCosta RicaCroatiaCubaCzechoslovakiaDenmarkDominicaDominican RepublicEastern AfricaEastern AsiaEastern EuropeEcuadorEgyptEl SalvadorEnglandEritreaEthiopiaEuropeFijiFranceGermanyGhanaGreeceGrenadaGuatemalaGuyanaHaitiHondurasHong KongHungaryIndiaIndonesiaIranIraqIrelandIsraelItalyJamaicaJapanJordanKazakhstanKenyaKoreaKuwaitLaosLatin AmericaLatviaLebanonLiberiaLithuaniaMalaysiaMexicoMicronesiaMiddle AfricaMoldovaMoroccoNepalNetherlandsNicaraguaNigeriaNorth AmericaNorth MacedoniaNorthern AfricaNorthern EuropeNorwayOceaniaPakistanPanamaPeruPhilippinesPolandPortugalRomaniaRussiaSaudi ArabiaScotlandSenegalSerbiaSierra LeoneSingaporeSomaliaSouth AfricaSouth AmericaSouth Central AsiaSouth Eastern AsiaSouthern EuropeSpainSri LankaSt. Vincent and the GrenadinesSudanSwedenSwitzerlandSyriaTaiwanThailandTrinidad and TobagoTurkeyUgandaUkraineUruguayUzbekistanVenezuelaVietnamWest IndiesWestern AfricaWestern AsiaWestern EuropeYemenZaireZimbabweAzores
Marshallese
Race
Ancestry
AfghanAfricanAlaska NativeAlaskan AthabascanAlbanianAleutAlsatianAmericanApacheArabArapahoArgentineanArmenianAssyrian/Chaldean/SyriacAustralianAustrianBahamianBangladeshiBarbadianBasqueBelgianBelizeanBermudanBhutaneseBlackfeetBolivianBrazilianBritishBritish West IndianBulgarianBurmeseCajunCambodianCanadianCape VerdeanCarpatho RusynCelticCentral AmericanCentral American IndianCherokeeCheyenneChickasawChileanChineseChippewaChoctawColombianColvilleComancheCosta RicanCreeCreekCroatianCrowCubanCypriotCzechCzechoslovakianDanishDelawareDominicanDutchDutch West IndianEastern EuropeanEcuadorianEgyptianEnglishEstonianEthiopianEuropeanFijianFilipinoFinnishFrenchFrench American IndianFrench CanadianGermanGerman RussianGhanaianGreekGuamanian/ChamorroGuatemalanGuyaneseHaitianHmongHonduranHopiHoumaHungarianIcelanderIndian (Asian)IndonesianInupiatIranianIraqiIrishIroquoisIsraeliItalianJamaicanJapaneseKenyanKiowaKoreanLaotianLatvianLebaneseLiberianLithuanianLumbeeLuxembourgerMacedonianMalaysianMalteseMarshalleseMenomineeMexicanMexican American IndianMongolianMoroccanNative HawaiianNavajoNepaleseNew ZealanderNicaraguanNigerianNorthern EuropeanNorwegianOkinawanOsageOttawaPaiutePakistaniPalestinianPanamanianParaguayanPennsylvania GermanPeruvianPimaPolishPortuguesePotawatomiPuebloPuerto RicanPuget Sound SalishRomanianRussianSalvadoranSamoanScandinavianScotch-IrishScottishSeminoleSenegaleseSerbianShoshoneSierra LeoneanSiouxSlavicSlovakSloveneSomaliSouth AfricanSouth AmericanSouth American IndianSoviet UnionSpaniardSpanishSpanish AmericanSpanish American IndianSri LankanSubsaharan AfricanSudaneseSwedishSwissSyrianTaiwaneseThaiTlingit-HaidaTohono O'OdhamTonganTrinidadian and TobagonianTsimshianTurkishU.S. Virgin IslanderUgandanUkrainianUruguayanUteVenezuelanVietnameseWelshWest IndianYakamaYaquiYugoslavianYumanYup'ikZimbabwean
Immigration
NonimmigrantsImmigrantsAfghanistanAfricaAlbaniaArgentinaArmeniaAsiaAustraliaAustriaBahamasBangladeshBarbadosBelarusBelgiumBelizeBoliviaBosnia and HerzegovinaBrazilBulgariaBurma/MyanmarCabo VerdeCambodiaCameroonCanadaCaribbeanCentral AmericaChileChinaColombiaCongoCosta RicaCroatiaCubaCzechoslovakiaDenmarkDominicaDominican RepublicEastern AfricaEastern AsiaEastern EuropeEcuadorEgyptEl SalvadorEnglandEritreaEthiopiaEuropeFijiFranceGermanyGhanaGreeceGrenadaGuatemalaGuyanaHaitiHondurasHong KongHungaryIndiaIndonesiaIranIraqIrelandIsraelItalyJamaicaJapanJordanKazakhstanKenyaKoreaKuwaitLaosLatin AmericaLatviaLebanonLiberiaLithuaniaMalaysiaMexicoMicronesiaMiddle AfricaMoldovaMoroccoNepalNetherlandsNicaraguaNigeriaNorth AmericaNorth MacedoniaNorthern AfricaNorthern EuropeNorwayOceaniaPakistanPanamaPeruPhilippinesPolandPortugalRomaniaRussiaSaudi ArabiaScotlandSenegalSerbiaSierra LeoneSingaporeSomaliaSouth AfricaSouth AmericaSouth Central AsiaSouth Eastern AsiaSouthern EuropeSpainSri LankaSt. Vincent and the GrenadinesSudanSwedenSwitzerlandSyriaTaiwanThailandTrinidad and TobagoTurkeyUgandaUkraineUruguayUzbekistanVenezuelaVietnamWest IndiesWestern AfricaWestern AsiaWestern EuropeYemenZaireZimbabweAzores
9th Grade
Income
Poverty
Unemployment
Labor Participation
Family Structure
Vehicle Availability
Education Level
Disability

9th Grade Comparison

Jordanians

Marshallese

Exceptional
Fair
95.3%
9TH GRADE
93.5/ 100
METRIC RATING
130th/ 347
METRIC RANK
94.7%
9TH GRADE
27.9/ 100
METRIC RATING
195th/ 347
METRIC RANK

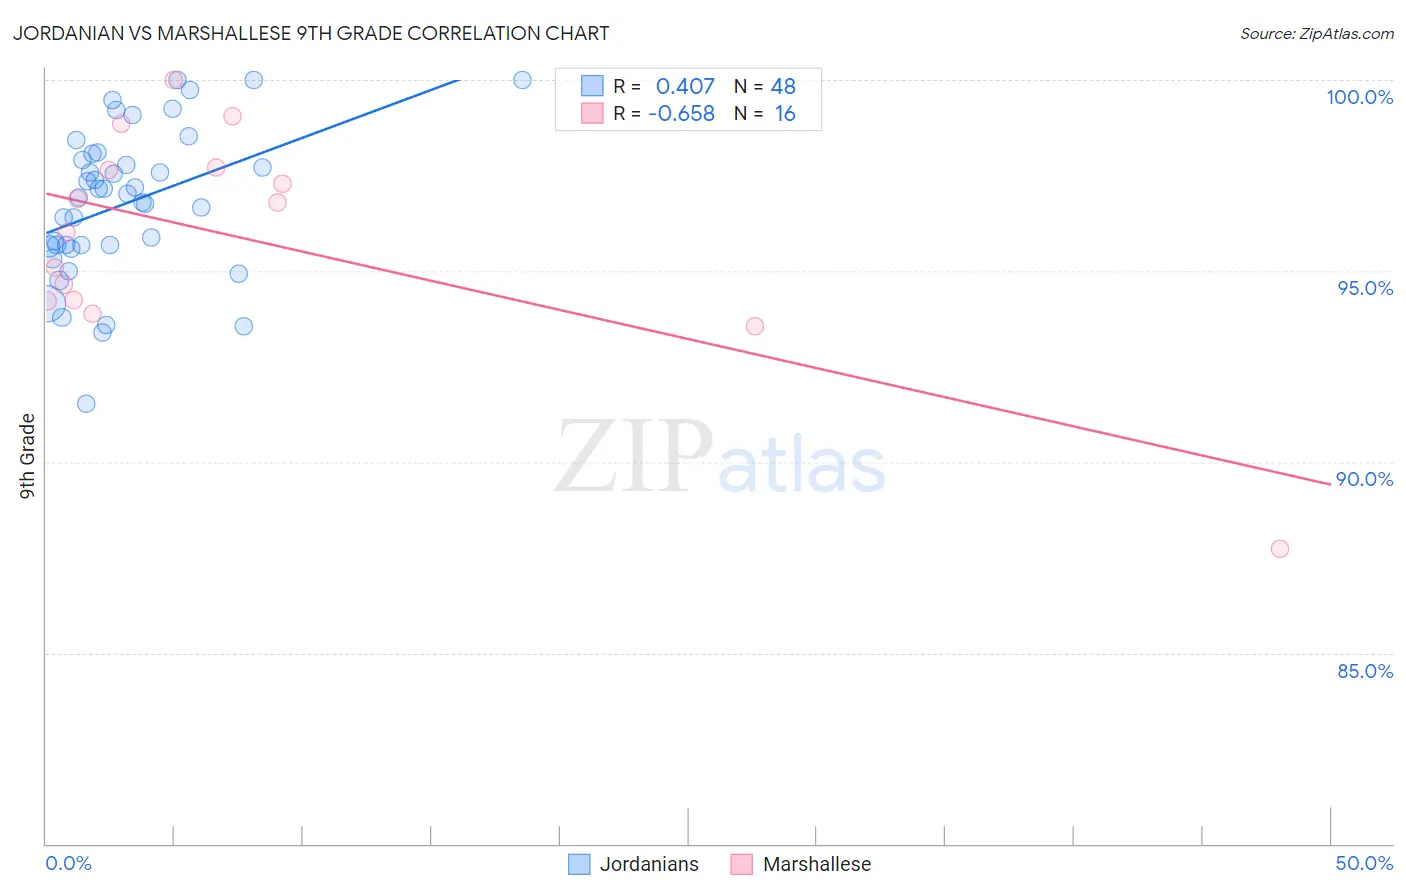
Jordanian vs Marshallese 9th Grade Correlation Chart

The statistical analysis conducted on geographies consisting of 166,403,553 people shows a moderate positive correlation between the proportion of Jordanians and percentage of population with at least 9th grade education in the United States with a correlation coefficient (R) of 0.407 and weighted average of 95.3%. Similarly, the statistical analysis conducted on geographies consisting of 14,761,315 people shows a significant negative correlation between the proportion of Marshallese and percentage of population with at least 9th grade education in the United States with a correlation coefficient (R) of -0.658 and weighted average of 94.7%, a difference of 0.67%.
Jordanian vs Marshallese 9th Grade

9th Grade Correlation Summary

MeasurementJordanianMarshallese
Minimum91.5%87.7%
Maximum100.0%100.0%
Range8.5%12.3%
Mean96.8%95.8%
Median97.0%96.4%
Interquartile 25% (IQ1)95.7%94.2%
Interquartile 75% (IQ3)98.0%97.7%
Interquartile Range (IQR)2.3%3.5%
Standard Deviation (Sample)1.9%2.9%
Standard Deviation (Population)1.9%2.8%

Similar Demographics by 9th Grade

Demographics Similar to Jordanians by 9th Grade

In terms of 9th grade, the demographic groups most similar to Jordanians are Palestinian (95.4%, a difference of 0.020%), Immigrants from Hungary (95.4%, a difference of 0.020%), Basque (95.4%, a difference of 0.020%), Immigrants from Serbia (95.4%, a difference of 0.030%), and Immigrants from North Macedonia (95.3%, a difference of 0.030%).
DemographicsRating | Rank9th Grade
Kiowa
95.3
/100
|
#123
Exceptional
95.4%
Shoshone
95.3
/100
|
#124
Exceptional
95.4%
Immigrants | South Central Asia
95.1
/100
|
#125
Exceptional
95.4%
Immigrants | Serbia
94.4
/100
|
#126
Exceptional
95.4%
Palestinians
94.3
/100
|
#127
Exceptional
95.4%
Immigrants | Hungary
94.2
/100
|
#128
Exceptional
95.4%
Basques
94.1
/100
|
#129
Exceptional
95.4%
Jordanians
93.5
/100
|
#130
Exceptional
95.3%
Immigrants | North Macedonia
92.3
/100
|
#131
Exceptional
95.3%
Immigrants | Nonimmigrants
92.0
/100
|
#132
Exceptional
95.3%
Israelis
90.4
/100
|
#133
Exceptional
95.3%
Immigrants | Israel
89.6
/100
|
#134
Excellent
95.3%
Immigrants | Belarus
88.9
/100
|
#135
Excellent
95.2%
Immigrants | Iran
88.3
/100
|
#136
Excellent
95.2%
Hmong
87.7
/100
|
#137
Excellent
95.2%

Demographics Similar to Marshallese by 9th Grade

In terms of 9th grade, the demographic groups most similar to Marshallese are Panamanian (94.7%, a difference of 0.010%), Immigrants from Lebanon (94.7%, a difference of 0.010%), Immigrants from Northern Africa (94.7%, a difference of 0.020%), Paraguayan (94.7%, a difference of 0.020%), and Immigrants from Micronesia (94.7%, a difference of 0.030%).
DemographicsRating | Rank9th Grade
Immigrants | Albania
34.5
/100
|
#188
Fair
94.8%
Immigrants | Argentina
34.4
/100
|
#189
Fair
94.8%
Sudanese
32.7
/100
|
#190
Fair
94.7%
Assyrians/Chaldeans/Syriacs
32.0
/100
|
#191
Fair
94.7%
Immigrants | Northern Africa
30.7
/100
|
#192
Fair
94.7%
Paraguayans
30.1
/100
|
#193
Fair
94.7%
Panamanians
29.0
/100
|
#194
Fair
94.7%
Marshallese
27.9
/100
|
#195
Fair
94.7%
Immigrants | Lebanon
27.2
/100
|
#196
Fair
94.7%
Immigrants | Micronesia
24.7
/100
|
#197
Fair
94.7%
Hawaiians
22.7
/100
|
#198
Fair
94.7%
Laotians
21.0
/100
|
#199
Fair
94.6%
Immigrants | Zaire
20.6
/100
|
#200
Fair
94.6%
Blacks/African Americans
20.5
/100
|
#201
Fair
94.6%
Immigrants | Eastern Asia
19.8
/100
|
#202
Poor
94.6%