Jordanian vs Immigrants from Sweden Bachelor's Degree
COMPARE
Jordanian
Immigrants from Sweden
Bachelor's Degree
Bachelor's Degree Comparison
Jordanians
Immigrants from Sweden
41.2%
BACHELOR'S DEGREE
97.4/ 100
METRIC RATING
104th/ 347
METRIC RANK
47.0%
BACHELOR'S DEGREE
100.0/ 100
METRIC RATING
23rd/ 347
METRIC RANK
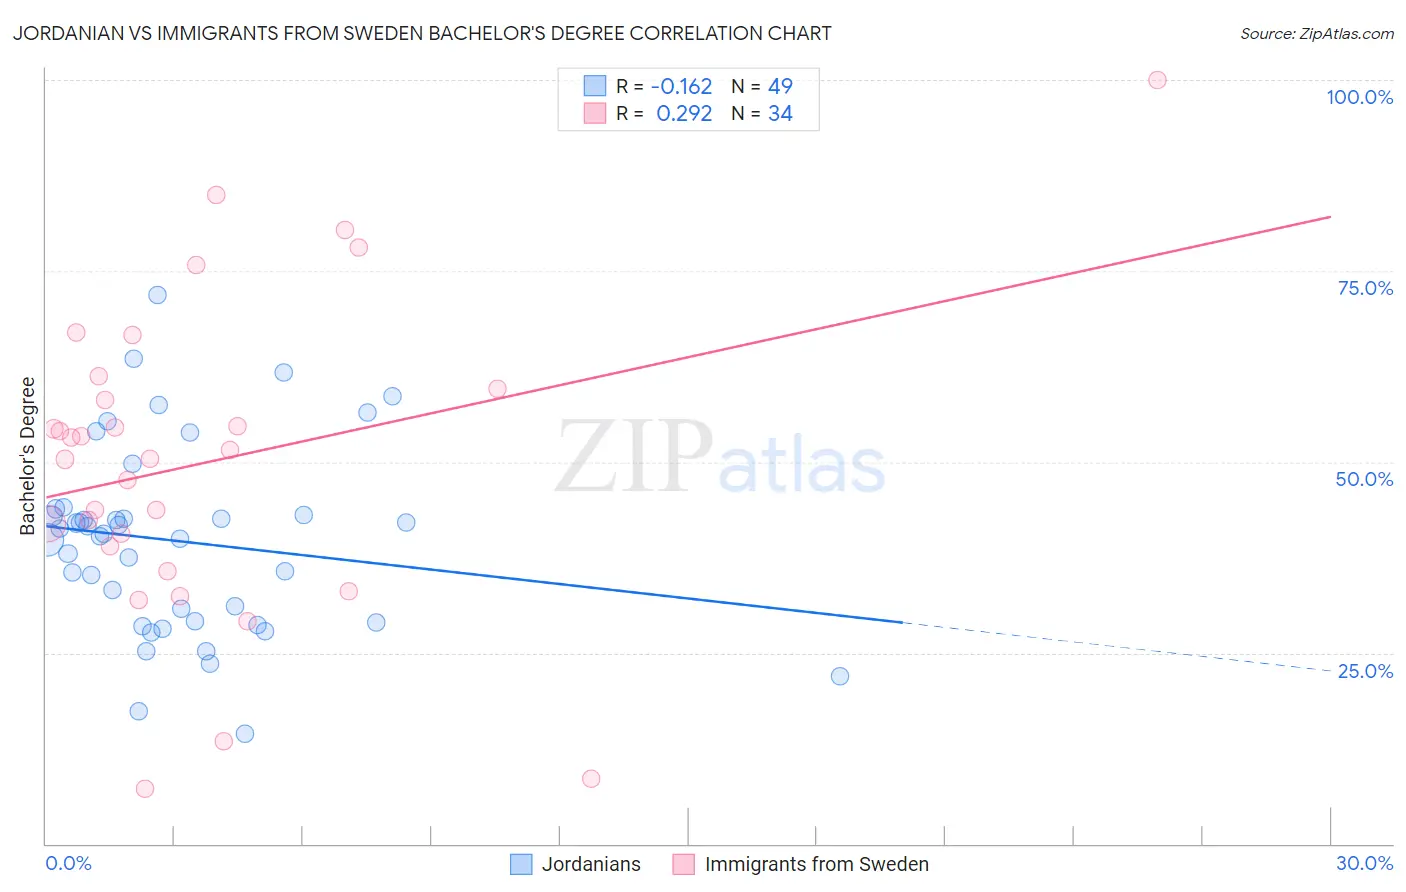
Jordanian vs Immigrants from Sweden Bachelor's Degree Correlation Chart
The statistical analysis conducted on geographies consisting of 166,421,482 people shows a poor negative correlation between the proportion of Jordanians and percentage of population with at least bachelor's degree education in the United States with a correlation coefficient (R) of -0.162 and weighted average of 41.2%. Similarly, the statistical analysis conducted on geographies consisting of 164,727,727 people shows a weak positive correlation between the proportion of Immigrants from Sweden and percentage of population with at least bachelor's degree education in the United States with a correlation coefficient (R) of 0.292 and weighted average of 47.0%, a difference of 14.2%.
Bachelor's Degree Correlation Summary
| Measurement | Jordanian | Immigrants from Sweden |
| Minimum | 14.4% | 7.1% |
| Maximum | 71.8% | 100.0% |
| Range | 57.4% | 92.9% |
| Mean | 39.6% | 49.9% |
| Median | 40.5% | 51.0% |
| Interquartile 25% (IQ1) | 29.1% | 39.0% |
| Interquartile 75% (IQ3) | 43.4% | 59.6% |
| Interquartile Range (IQR) | 14.3% | 20.6% |
| Standard Deviation (Sample) | 12.2% | 20.5% |
| Standard Deviation (Population) | 12.1% | 20.2% |
Similar Demographics by Bachelor's Degree
Demographics Similar to Jordanians by Bachelor's Degree
In terms of bachelor's degree, the demographic groups most similar to Jordanians are Syrian (41.1%, a difference of 0.030%), Chilean (41.2%, a difference of 0.060%), Alsatian (41.0%, a difference of 0.29%), Immigrants from Italy (41.3%, a difference of 0.40%), and Northern European (41.0%, a difference of 0.46%).
| Demographics | Rating | Rank | Bachelor's Degree |
| Romanians | 98.4 /100 | #97 | Exceptional 41.6% |
| Immigrants | Ukraine | 98.3 /100 | #98 | Exceptional 41.5% |
| Immigrants | England | 98.1 /100 | #99 | Exceptional 41.4% |
| Macedonians | 98.1 /100 | #100 | Exceptional 41.4% |
| Immigrants | Morocco | 98.0 /100 | #101 | Exceptional 41.4% |
| Immigrants | Italy | 97.8 /100 | #102 | Exceptional 41.3% |
| Chileans | 97.5 /100 | #103 | Exceptional 41.2% |
| Jordanians | 97.4 /100 | #104 | Exceptional 41.2% |
| Syrians | 97.4 /100 | #105 | Exceptional 41.1% |
| Alsatians | 97.0 /100 | #106 | Exceptional 41.0% |
| Northern Europeans | 96.8 /100 | #107 | Exceptional 41.0% |
| Ukrainians | 96.6 /100 | #108 | Exceptional 40.9% |
| Arabs | 96.6 /100 | #109 | Exceptional 40.9% |
| Albanians | 96.5 /100 | #110 | Exceptional 40.9% |
| Immigrants | Chile | 96.4 /100 | #111 | Exceptional 40.8% |
Demographics Similar to Immigrants from Sweden by Bachelor's Degree
In terms of bachelor's degree, the demographic groups most similar to Immigrants from Sweden are Immigrants from Korea (47.0%, a difference of 0.040%), Immigrants from Belgium (47.0%, a difference of 0.090%), Burmese (46.9%, a difference of 0.26%), Immigrants from Ireland (47.1%, a difference of 0.29%), and Immigrants from Switzerland (47.1%, a difference of 0.30%).
| Demographics | Rating | Rank | Bachelor's Degree |
| Soviet Union | 100.0 /100 | #16 | Exceptional 47.9% |
| Eastern Europeans | 100.0 /100 | #17 | Exceptional 47.5% |
| Indians (Asian) | 100.0 /100 | #18 | Exceptional 47.4% |
| Cambodians | 100.0 /100 | #19 | Exceptional 47.2% |
| Immigrants | Switzerland | 100.0 /100 | #20 | Exceptional 47.1% |
| Immigrants | Ireland | 100.0 /100 | #21 | Exceptional 47.1% |
| Immigrants | Belgium | 100.0 /100 | #22 | Exceptional 47.0% |
| Immigrants | Sweden | 100.0 /100 | #23 | Exceptional 47.0% |
| Immigrants | Korea | 100.0 /100 | #24 | Exceptional 47.0% |
| Burmese | 100.0 /100 | #25 | Exceptional 46.9% |
| Immigrants | Japan | 100.0 /100 | #26 | Exceptional 46.8% |
| Immigrants | France | 100.0 /100 | #27 | Exceptional 46.4% |
| Turks | 100.0 /100 | #28 | Exceptional 46.2% |
| Israelis | 100.0 /100 | #29 | Exceptional 46.1% |
| Immigrants | Sri Lanka | 100.0 /100 | #30 | Exceptional 46.1% |