Jordanian vs Immigrants from Latvia 11th Grade
COMPARE
Jordanian
Immigrants from Latvia
11th Grade
11th Grade Comparison
Jordanians
Immigrants from Latvia
93.4%
11TH GRADE
97.8/ 100
METRIC RATING
114th/ 347
METRIC RANK
93.8%
11TH GRADE
99.6/ 100
METRIC RATING
75th/ 347
METRIC RANK
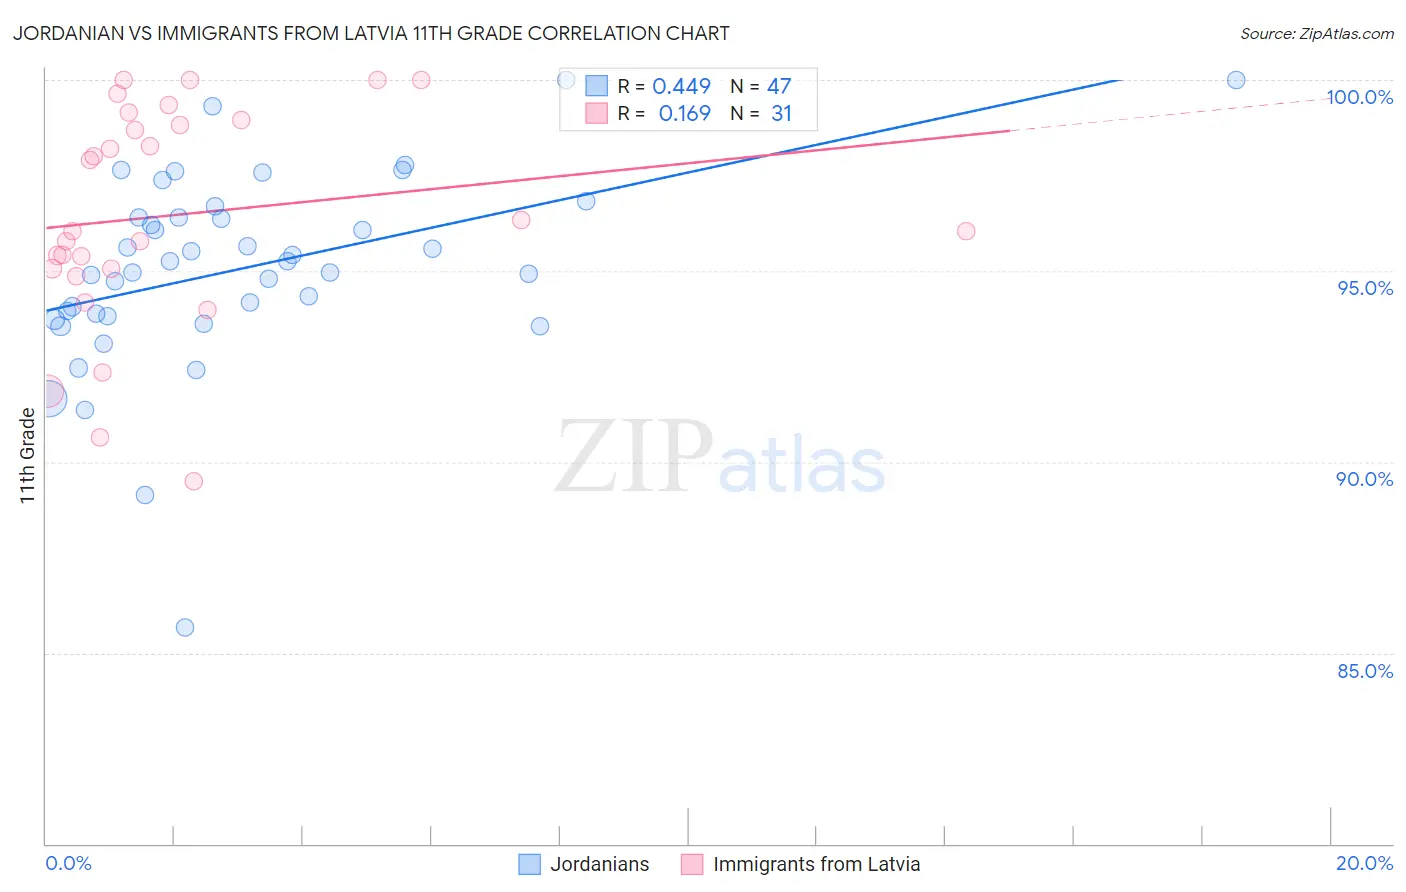
Jordanian vs Immigrants from Latvia 11th Grade Correlation Chart
The statistical analysis conducted on geographies consisting of 166,402,085 people shows a moderate positive correlation between the proportion of Jordanians and percentage of population with at least 11th grade education in the United States with a correlation coefficient (R) of 0.449 and weighted average of 93.4%. Similarly, the statistical analysis conducted on geographies consisting of 113,735,345 people shows a poor positive correlation between the proportion of Immigrants from Latvia and percentage of population with at least 11th grade education in the United States with a correlation coefficient (R) of 0.169 and weighted average of 93.8%, a difference of 0.42%.
11th Grade Correlation Summary
| Measurement | Jordanian | Immigrants from Latvia |
| Minimum | 85.7% | 89.5% |
| Maximum | 100.0% | 100.0% |
| Range | 14.3% | 10.5% |
| Mean | 95.1% | 96.5% |
| Median | 95.2% | 96.1% |
| Interquartile 25% (IQ1) | 93.8% | 95.1% |
| Interquartile 75% (IQ3) | 96.4% | 98.9% |
| Interquartile Range (IQR) | 2.6% | 3.9% |
| Standard Deviation (Sample) | 2.6% | 2.9% |
| Standard Deviation (Population) | 2.5% | 2.8% |
Similar Demographics by 11th Grade
Demographics Similar to Jordanians by 11th Grade
In terms of 11th grade, the demographic groups most similar to Jordanians are Immigrants from Zimbabwe (93.4%, a difference of 0.0%), Palestinian (93.4%, a difference of 0.010%), Immigrants from Germany (93.4%, a difference of 0.030%), Immigrants from Hungary (93.4%, a difference of 0.030%), and Yugoslavian (93.4%, a difference of 0.040%).
| Demographics | Rating | Rank | 11th Grade |
| Immigrants | Norway | 98.4 /100 | #107 | Exceptional 93.5% |
| Alaska Natives | 98.4 /100 | #108 | Exceptional 93.5% |
| Immigrants | Kuwait | 98.4 /100 | #109 | Exceptional 93.5% |
| Syrians | 98.4 /100 | #110 | Exceptional 93.4% |
| Yugoslavians | 98.1 /100 | #111 | Exceptional 93.4% |
| Immigrants | Germany | 98.0 /100 | #112 | Exceptional 93.4% |
| Immigrants | Zimbabwe | 97.8 /100 | #113 | Exceptional 93.4% |
| Jordanians | 97.8 /100 | #114 | Exceptional 93.4% |
| Palestinians | 97.7 /100 | #115 | Exceptional 93.4% |
| Immigrants | Hungary | 97.5 /100 | #116 | Exceptional 93.4% |
| Whites/Caucasians | 97.4 /100 | #117 | Exceptional 93.3% |
| Immigrants | Korea | 97.0 /100 | #118 | Exceptional 93.3% |
| Israelis | 97.0 /100 | #119 | Exceptional 93.3% |
| Immigrants | Russia | 96.6 /100 | #120 | Exceptional 93.3% |
| German Russians | 96.4 /100 | #121 | Exceptional 93.3% |
Demographics Similar to Immigrants from Latvia by 11th Grade
In terms of 11th grade, the demographic groups most similar to Immigrants from Latvia are Romanian (93.8%, a difference of 0.020%), Immigrants from Czechoslovakia (93.8%, a difference of 0.020%), Celtic (93.7%, a difference of 0.030%), Aleut (93.7%, a difference of 0.030%), and Soviet Union (93.7%, a difference of 0.030%).
| Demographics | Rating | Rank | 11th Grade |
| Zimbabweans | 99.8 /100 | #68 | Exceptional 93.9% |
| Scotch-Irish | 99.8 /100 | #69 | Exceptional 93.9% |
| Immigrants | England | 99.7 /100 | #70 | Exceptional 93.8% |
| Immigrants | South Africa | 99.7 /100 | #71 | Exceptional 93.8% |
| Immigrants | Japan | 99.7 /100 | #72 | Exceptional 93.8% |
| Romanians | 99.6 /100 | #73 | Exceptional 93.8% |
| Immigrants | Czechoslovakia | 99.6 /100 | #74 | Exceptional 93.8% |
| Immigrants | Latvia | 99.6 /100 | #75 | Exceptional 93.8% |
| Celtics | 99.5 /100 | #76 | Exceptional 93.7% |
| Aleuts | 99.5 /100 | #77 | Exceptional 93.7% |
| Soviet Union | 99.5 /100 | #78 | Exceptional 93.7% |
| Immigrants | Denmark | 99.5 /100 | #79 | Exceptional 93.7% |
| Canadians | 99.5 /100 | #80 | Exceptional 93.7% |
| Immigrants | Moldova | 99.5 /100 | #81 | Exceptional 93.7% |
| Immigrants | Saudi Arabia | 99.3 /100 | #82 | Exceptional 93.7% |