Jordanian vs Central American 10th Grade
COMPARE
Jordanian
Central American
10th Grade
10th Grade Comparison
Jordanians
Central Americans
94.4%
10TH GRADE
95.6/ 100
METRIC RATING
118th/ 347
METRIC RANK
88.4%
10TH GRADE
0.0/ 100
METRIC RATING
337th/ 347
METRIC RANK
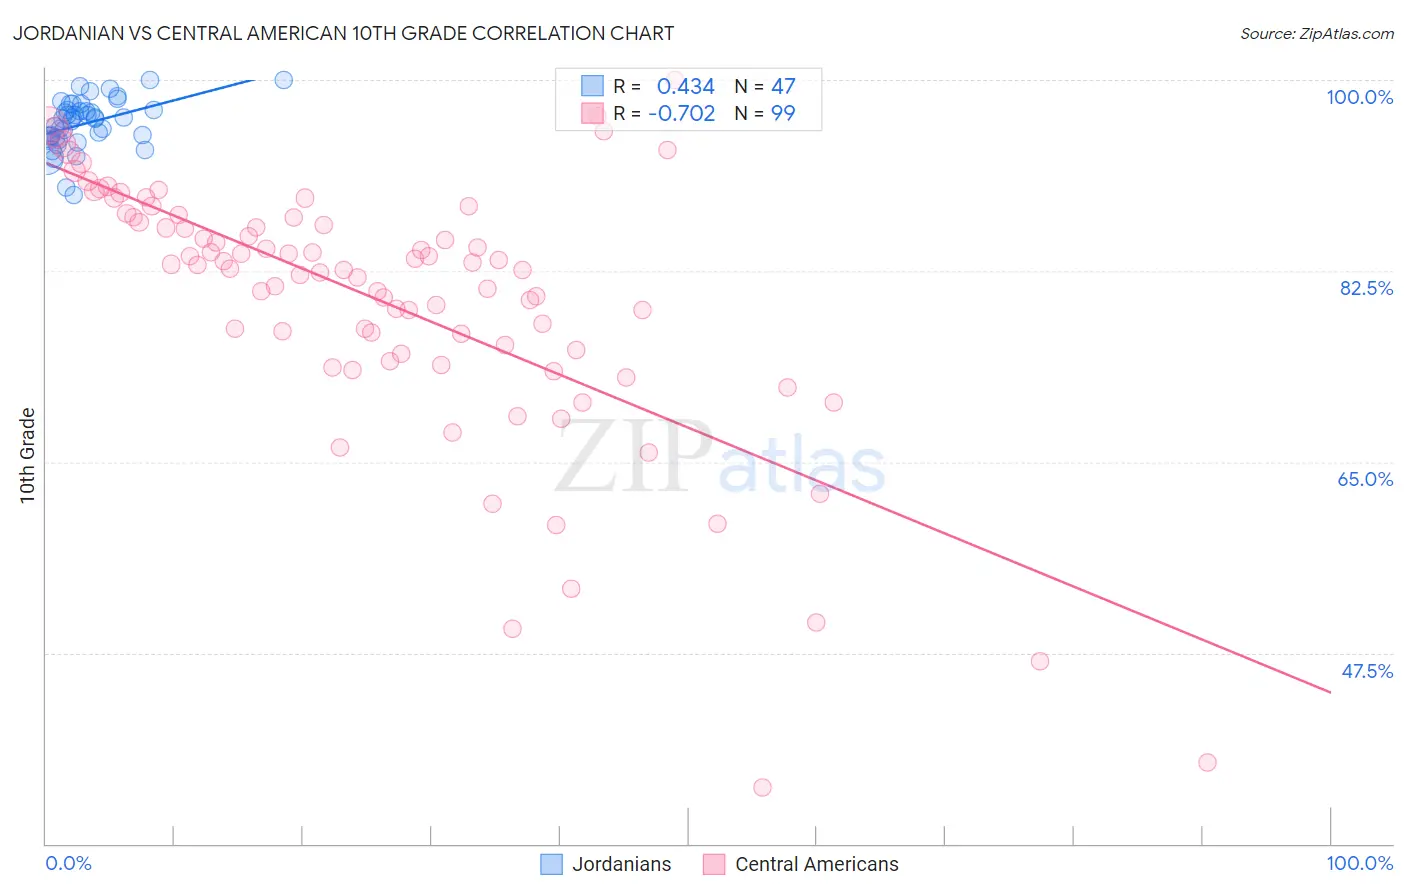
Jordanian vs Central American 10th Grade Correlation Chart
The statistical analysis conducted on geographies consisting of 166,402,085 people shows a moderate positive correlation between the proportion of Jordanians and percentage of population with at least 10th grade education in the United States with a correlation coefficient (R) of 0.434 and weighted average of 94.4%. Similarly, the statistical analysis conducted on geographies consisting of 504,619,347 people shows a strong negative correlation between the proportion of Central Americans and percentage of population with at least 10th grade education in the United States with a correlation coefficient (R) of -0.702 and weighted average of 88.4%, a difference of 6.8%.
10th Grade Correlation Summary
| Measurement | Jordanian | Central American |
| Minimum | 89.5% | 35.2% |
| Maximum | 100.0% | 100.0% |
| Range | 10.5% | 64.8% |
| Mean | 96.0% | 79.6% |
| Median | 96.4% | 82.7% |
| Interquartile 25% (IQ1) | 94.7% | 74.9% |
| Interquartile 75% (IQ3) | 97.3% | 87.4% |
| Interquartile Range (IQR) | 2.6% | 12.6% |
| Standard Deviation (Sample) | 2.3% | 12.1% |
| Standard Deviation (Population) | 2.2% | 12.1% |
Similar Demographics by 10th Grade
Demographics Similar to Jordanians by 10th Grade
In terms of 10th grade, the demographic groups most similar to Jordanians are Immigrants from Hungary (94.4%, a difference of 0.010%), Immigrants from Israel (94.4%, a difference of 0.010%), Immigrants from Taiwan (94.4%, a difference of 0.010%), Immigrants from Belarus (94.4%, a difference of 0.020%), and Inupiat (94.4%, a difference of 0.020%).
| Demographics | Rating | Rank | 10th Grade |
| Immigrants | Zimbabwe | 96.8 /100 | #111 | Exceptional 94.4% |
| Immigrants | Kuwait | 96.8 /100 | #112 | Exceptional 94.4% |
| Palestinians | 96.5 /100 | #113 | Exceptional 94.4% |
| German Russians | 96.3 /100 | #114 | Exceptional 94.4% |
| Delaware | 96.3 /100 | #115 | Exceptional 94.4% |
| Sioux | 96.2 /100 | #116 | Exceptional 94.4% |
| Immigrants | Hungary | 95.8 /100 | #117 | Exceptional 94.4% |
| Jordanians | 95.6 /100 | #118 | Exceptional 94.4% |
| Immigrants | Israel | 95.4 /100 | #119 | Exceptional 94.4% |
| Immigrants | Taiwan | 95.3 /100 | #120 | Exceptional 94.4% |
| Immigrants | Belarus | 95.2 /100 | #121 | Exceptional 94.4% |
| Inupiat | 95.1 /100 | #122 | Exceptional 94.4% |
| Cree | 95.1 /100 | #123 | Exceptional 94.4% |
| Basques | 94.9 /100 | #124 | Exceptional 94.3% |
| Americans | 94.4 /100 | #125 | Exceptional 94.3% |
Demographics Similar to Central Americans by 10th Grade
In terms of 10th grade, the demographic groups most similar to Central Americans are Immigrants from Latin America (88.3%, a difference of 0.060%), Immigrants from Honduras (88.5%, a difference of 0.15%), Immigrants from Dominican Republic (88.7%, a difference of 0.35%), Hispanic or Latino (88.9%, a difference of 0.53%), and Guatemalan (87.9%, a difference of 0.56%).
| Demographics | Rating | Rank | 10th Grade |
| Immigrants | Yemen | 0.0 /100 | #330 | Tragic 89.1% |
| Mexican American Indians | 0.0 /100 | #331 | Tragic 89.0% |
| Immigrants | Azores | 0.0 /100 | #332 | Tragic 89.0% |
| Hondurans | 0.0 /100 | #333 | Tragic 89.0% |
| Hispanics or Latinos | 0.0 /100 | #334 | Tragic 88.9% |
| Immigrants | Dominican Republic | 0.0 /100 | #335 | Tragic 88.7% |
| Immigrants | Honduras | 0.0 /100 | #336 | Tragic 88.5% |
| Central Americans | 0.0 /100 | #337 | Tragic 88.4% |
| Immigrants | Latin America | 0.0 /100 | #338 | Tragic 88.3% |
| Guatemalans | 0.0 /100 | #339 | Tragic 87.9% |
| Mexicans | 0.0 /100 | #340 | Tragic 87.8% |
| Salvadorans | 0.0 /100 | #341 | Tragic 87.5% |
| Immigrants | Guatemala | 0.0 /100 | #342 | Tragic 87.4% |
| Yakama | 0.0 /100 | #343 | Tragic 86.9% |
| Immigrants | El Salvador | 0.0 /100 | #344 | Tragic 86.8% |