Japanese vs Immigrants from Bulgaria 8th Grade

COMPARE

Japanese
Race
Ancestry
AfghanAfricanAlaska NativeAlaskan AthabascanAlbanianAleutAlsatianAmericanApacheArabArapahoArgentineanArmenianAssyrian/Chaldean/SyriacAustralianAustrianBahamianBangladeshiBarbadianBasqueBelgianBelizeanBermudanBhutaneseBlackfeetBolivianBrazilianBritishBritish West IndianBulgarianBurmeseCajunCambodianCanadianCape VerdeanCarpatho RusynCelticCentral AmericanCentral American IndianCherokeeCheyenneChickasawChileanChineseChippewaChoctawColombianColvilleComancheCosta RicanCreeCreekCroatianCrowCubanCypriotCzechCzechoslovakianDanishDelawareDominicanDutchDutch West IndianEastern EuropeanEcuadorianEgyptianEnglishEstonianEthiopianEuropeanFijianFilipinoFinnishFrenchFrench American IndianFrench CanadianGermanGerman RussianGhanaianGreekGuamanian/ChamorroGuatemalanGuyaneseHaitianHmongHonduranHopiHoumaHungarianIcelanderIndian (Asian)IndonesianInupiatIranianIraqiIrishIroquoisIsraeliItalianJamaicanJapaneseJordanianKenyanKiowaKoreanLaotianLatvianLebaneseLiberianLithuanianLumbeeLuxembourgerMacedonianMalaysianMalteseMarshalleseMenomineeMexicanMexican American IndianMongolianMoroccanNative HawaiianNavajoNepaleseNew ZealanderNicaraguanNigerianNorthern EuropeanNorwegianOkinawanOsageOttawaPaiutePakistaniPalestinianPanamanianParaguayanPennsylvania GermanPeruvianPimaPolishPortuguesePotawatomiPuebloPuerto RicanPuget Sound SalishRomanianRussianSalvadoranSamoanScandinavianScotch-IrishScottishSeminoleSenegaleseSerbianShoshoneSierra LeoneanSiouxSlavicSlovakSloveneSomaliSouth AfricanSouth AmericanSouth American IndianSoviet UnionSpaniardSpanishSpanish AmericanSpanish American IndianSri LankanSubsaharan AfricanSudaneseSwedishSwissSyrianTaiwaneseThaiTlingit-HaidaTohono O'OdhamTonganTrinidadian and TobagonianTsimshianTurkishU.S. Virgin IslanderUgandanUkrainianUruguayanUteVenezuelanVietnameseWelshWest IndianYakamaYaquiYugoslavianYumanYup'ikZimbabwean
Immigration
NonimmigrantsImmigrantsAfghanistanAfricaAlbaniaArgentinaArmeniaAsiaAustraliaAustriaBahamasBangladeshBarbadosBelarusBelgiumBelizeBoliviaBosnia and HerzegovinaBrazilBurma/MyanmarCabo VerdeCambodiaCameroonCanadaCaribbeanCentral AmericaChileChinaColombiaCongoCosta RicaCroatiaCubaCzechoslovakiaDenmarkDominicaDominican RepublicEastern AfricaEastern AsiaEastern EuropeEcuadorEgyptEl SalvadorEnglandEritreaEthiopiaEuropeFijiFranceGermanyGhanaGreeceGrenadaGuatemalaGuyanaHaitiHondurasHong KongHungaryIndiaIndonesiaIranIraqIrelandIsraelItalyJamaicaJapanJordanKazakhstanKenyaKoreaKuwaitLaosLatin AmericaLatviaLebanonLiberiaLithuaniaMalaysiaMexicoMicronesiaMiddle AfricaMoldovaMoroccoNepalNetherlandsNicaraguaNigeriaNorth AmericaNorth MacedoniaNorthern AfricaNorthern EuropeNorwayOceaniaPakistanPanamaPeruPhilippinesPolandPortugalRomaniaRussiaSaudi ArabiaScotlandSenegalSerbiaSierra LeoneSingaporeSomaliaSouth AfricaSouth AmericaSouth Central AsiaSouth Eastern AsiaSouthern EuropeSpainSri LankaSt. Vincent and the GrenadinesSudanSwedenSwitzerlandSyriaTaiwanThailandTrinidad and TobagoTurkeyUgandaUkraineUruguayUzbekistanVenezuelaVietnamWest IndiesWestern AfricaWestern AsiaWestern EuropeYemenZaireZimbabweAzores
Immigrants from Bulgaria
Race
Ancestry
AfghanAfricanAlaska NativeAlaskan AthabascanAlbanianAleutAlsatianAmericanApacheArabArapahoArgentineanArmenianAssyrian/Chaldean/SyriacAustralianAustrianBahamianBangladeshiBarbadianBasqueBelgianBelizeanBermudanBhutaneseBlackfeetBolivianBrazilianBritishBritish West IndianBulgarianBurmeseCajunCambodianCanadianCape VerdeanCarpatho RusynCelticCentral AmericanCentral American IndianCherokeeCheyenneChickasawChileanChineseChippewaChoctawColombianColvilleComancheCosta RicanCreeCreekCroatianCrowCubanCypriotCzechCzechoslovakianDanishDelawareDominicanDutchDutch West IndianEastern EuropeanEcuadorianEgyptianEnglishEstonianEthiopianEuropeanFijianFilipinoFinnishFrenchFrench American IndianFrench CanadianGermanGerman RussianGhanaianGreekGuamanian/ChamorroGuatemalanGuyaneseHaitianHmongHonduranHopiHoumaHungarianIcelanderIndian (Asian)IndonesianInupiatIranianIraqiIrishIroquoisIsraeliItalianJamaicanJordanianKenyanKiowaKoreanLaotianLatvianLebaneseLiberianLithuanianLumbeeLuxembourgerMacedonianMalaysianMalteseMarshalleseMenomineeMexicanMexican American IndianMongolianMoroccanNative HawaiianNavajoNepaleseNew ZealanderNicaraguanNigerianNorthern EuropeanNorwegianOkinawanOsageOttawaPaiutePakistaniPalestinianPanamanianParaguayanPennsylvania GermanPeruvianPimaPolishPortuguesePotawatomiPuebloPuerto RicanPuget Sound SalishRomanianRussianSalvadoranSamoanScandinavianScotch-IrishScottishSeminoleSenegaleseSerbianShoshoneSierra LeoneanSiouxSlavicSlovakSloveneSomaliSouth AfricanSouth AmericanSouth American IndianSoviet UnionSpaniardSpanishSpanish AmericanSpanish American IndianSri LankanSubsaharan AfricanSudaneseSwedishSwissSyrianTaiwaneseThaiTlingit-HaidaTohono O'OdhamTonganTrinidadian and TobagonianTsimshianTurkishU.S. Virgin IslanderUgandanUkrainianUruguayanUteVenezuelanVietnameseWelshWest IndianYakamaYaquiYugoslavianYumanYup'ikZimbabwean
Immigration
NonimmigrantsImmigrantsAfghanistanAfricaAlbaniaArgentinaArmeniaAsiaAustraliaAustriaBahamasBangladeshBarbadosBelarusBelgiumBelizeBoliviaBosnia and HerzegovinaBrazilBulgariaBurma/MyanmarCabo VerdeCambodiaCameroonCanadaCaribbeanCentral AmericaChileChinaColombiaCongoCosta RicaCroatiaCubaCzechoslovakiaDenmarkDominicaDominican RepublicEastern AfricaEastern AsiaEastern EuropeEcuadorEgyptEl SalvadorEnglandEritreaEthiopiaEuropeFijiFranceGermanyGhanaGreeceGrenadaGuatemalaGuyanaHaitiHondurasHong KongHungaryIndiaIndonesiaIranIraqIrelandIsraelItalyJamaicaJapanJordanKazakhstanKenyaKoreaKuwaitLaosLatin AmericaLatviaLebanonLiberiaLithuaniaMalaysiaMexicoMicronesiaMiddle AfricaMoldovaMoroccoNepalNetherlandsNicaraguaNigeriaNorth AmericaNorth MacedoniaNorthern AfricaNorthern EuropeNorwayOceaniaPakistanPanamaPeruPhilippinesPolandPortugalRomaniaRussiaSaudi ArabiaScotlandSenegalSerbiaSierra LeoneSingaporeSomaliaSouth AfricaSouth AmericaSouth Central AsiaSouth Eastern AsiaSouthern EuropeSpainSri LankaSt. Vincent and the GrenadinesSudanSwedenSwitzerlandSyriaTaiwanThailandTrinidad and TobagoTurkeyUgandaUkraineUruguayUzbekistanVenezuelaVietnamWest IndiesWestern AfricaWestern AsiaWestern EuropeYemenZaireZimbabweAzores
8th Grade
Income
Poverty
Unemployment
Labor Participation
Family Structure
Vehicle Availability
Education Level
Disability

8th Grade Comparison

Japanese

Immigrants from Bulgaria

Tragic
Exceptional
93.6%
8TH GRADE
0.0/ 100
METRIC RATING
310th/ 347
METRIC RANK
96.2%
8TH GRADE
95.3/ 100
METRIC RATING
121st/ 347
METRIC RANK

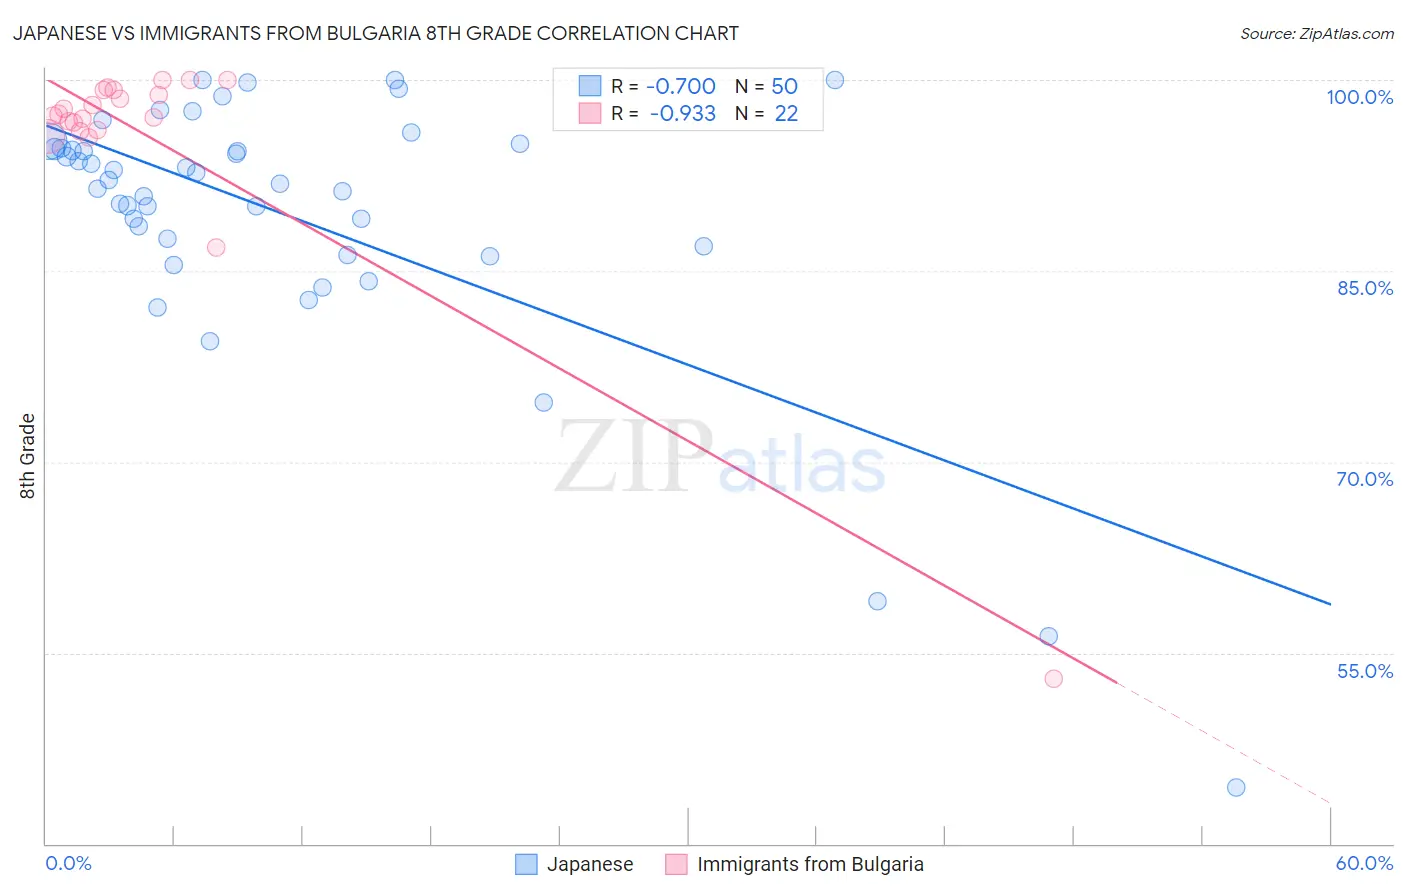
Japanese vs Immigrants from Bulgaria 8th Grade Correlation Chart

The statistical analysis conducted on geographies consisting of 249,183,224 people shows a strong negative correlation between the proportion of Japanese and percentage of population with at least 8th grade education in the United States with a correlation coefficient (R) of -0.700 and weighted average of 93.6%. Similarly, the statistical analysis conducted on geographies consisting of 172,552,181 people shows a near-perfect negative correlation between the proportion of Immigrants from Bulgaria and percentage of population with at least 8th grade education in the United States with a correlation coefficient (R) of -0.933 and weighted average of 96.2%, a difference of 2.8%.
Japanese vs Immigrants from Bulgaria 8th Grade

8th Grade Correlation Summary

MeasurementJapaneseImmigrants from Bulgaria
Minimum44.4%52.9%
Maximum100.0%100.0%
Range55.6%47.1%
Mean89.3%95.3%
Median92.0%97.2%
Interquartile 25% (IQ1)86.9%96.0%
Interquartile 75% (IQ3)94.6%99.2%
Interquartile Range (IQR)7.8%3.2%
Standard Deviation (Sample)10.8%9.8%
Standard Deviation (Population)10.7%9.6%

Similar Demographics by 8th Grade

Demographics Similar to Japanese by 8th Grade

In terms of 8th grade, the demographic groups most similar to Japanese are Immigrants (93.6%, a difference of 0.0%), Immigrants from Bangladesh (93.6%, a difference of 0.0%), Ecuadorian (93.6%, a difference of 0.030%), Cape Verdean (93.5%, a difference of 0.040%), and Immigrants from Caribbean (93.5%, a difference of 0.070%).
DemographicsRating | Rank8th Grade
Immigrants | Dominica
0.0
/100
|
#303
Tragic
94.0%
Guyanese
0.0
/100
|
#304
Tragic
93.9%
Immigrants | Haiti
0.0
/100
|
#305
Tragic
93.9%
Immigrants | Guyana
0.0
/100
|
#306
Tragic
93.8%
Immigrants | Portugal
0.0
/100
|
#307
Tragic
93.8%
Ecuadorians
0.0
/100
|
#308
Tragic
93.6%
Immigrants | Immigrants
0.0
/100
|
#309
Tragic
93.6%
Japanese
0.0
/100
|
#310
Tragic
93.6%
Immigrants | Bangladesh
0.0
/100
|
#311
Tragic
93.6%
Cape Verdeans
0.0
/100
|
#312
Tragic
93.5%
Immigrants | Caribbean
0.0
/100
|
#313
Tragic
93.5%
Immigrants | Vietnam
0.0
/100
|
#314
Tragic
93.5%
Vietnamese
0.0
/100
|
#315
Tragic
93.5%
Immigrants | Cambodia
0.0
/100
|
#316
Tragic
93.3%
Immigrants | Ecuador
0.0
/100
|
#317
Tragic
93.3%

Demographics Similar to Immigrants from Bulgaria by 8th Grade

In terms of 8th grade, the demographic groups most similar to Immigrants from Bulgaria are Immigrants from Switzerland (96.2%, a difference of 0.0%), Immigrants from France (96.2%, a difference of 0.0%), Immigrants from Europe (96.2%, a difference of 0.0%), Immigrants from Norway (96.2%, a difference of 0.020%), and Filipino (96.2%, a difference of 0.020%).
DemographicsRating | Rank8th Grade
Immigrants | Japan
96.5
/100
|
#114
Exceptional
96.2%
Immigrants | Moldova
96.5
/100
|
#115
Exceptional
96.2%
Immigrants | Nonimmigrants
96.0
/100
|
#116
Exceptional
96.2%
Immigrants | Croatia
96.0
/100
|
#117
Exceptional
96.2%
Immigrants | Norway
95.7
/100
|
#118
Exceptional
96.2%
Immigrants | Switzerland
95.3
/100
|
#119
Exceptional
96.2%
Immigrants | France
95.3
/100
|
#120
Exceptional
96.2%
Immigrants | Bulgaria
95.3
/100
|
#121
Exceptional
96.2%
Immigrants | Europe
95.3
/100
|
#122
Exceptional
96.2%
Filipinos
94.6
/100
|
#123
Exceptional
96.2%
Palestinians
94.6
/100
|
#124
Exceptional
96.2%
Immigrants | Romania
94.1
/100
|
#125
Exceptional
96.2%
Choctaw
94.0
/100
|
#126
Exceptional
96.2%
Immigrants | Serbia
94.0
/100
|
#127
Exceptional
96.2%
Immigrants | Bosnia and Herzegovina
93.9
/100
|
#128
Exceptional
96.2%