Japanese vs Cherokee 5th Grade
COMPARE
Japanese
Cherokee
5th Grade
5th Grade Comparison
Japanese
Cherokee
95.7%
5TH GRADE
0.0/ 100
METRIC RATING
319th/ 347
METRIC RANK
97.8%
5TH GRADE
99.4/ 100
METRIC RATING
73rd/ 347
METRIC RANK
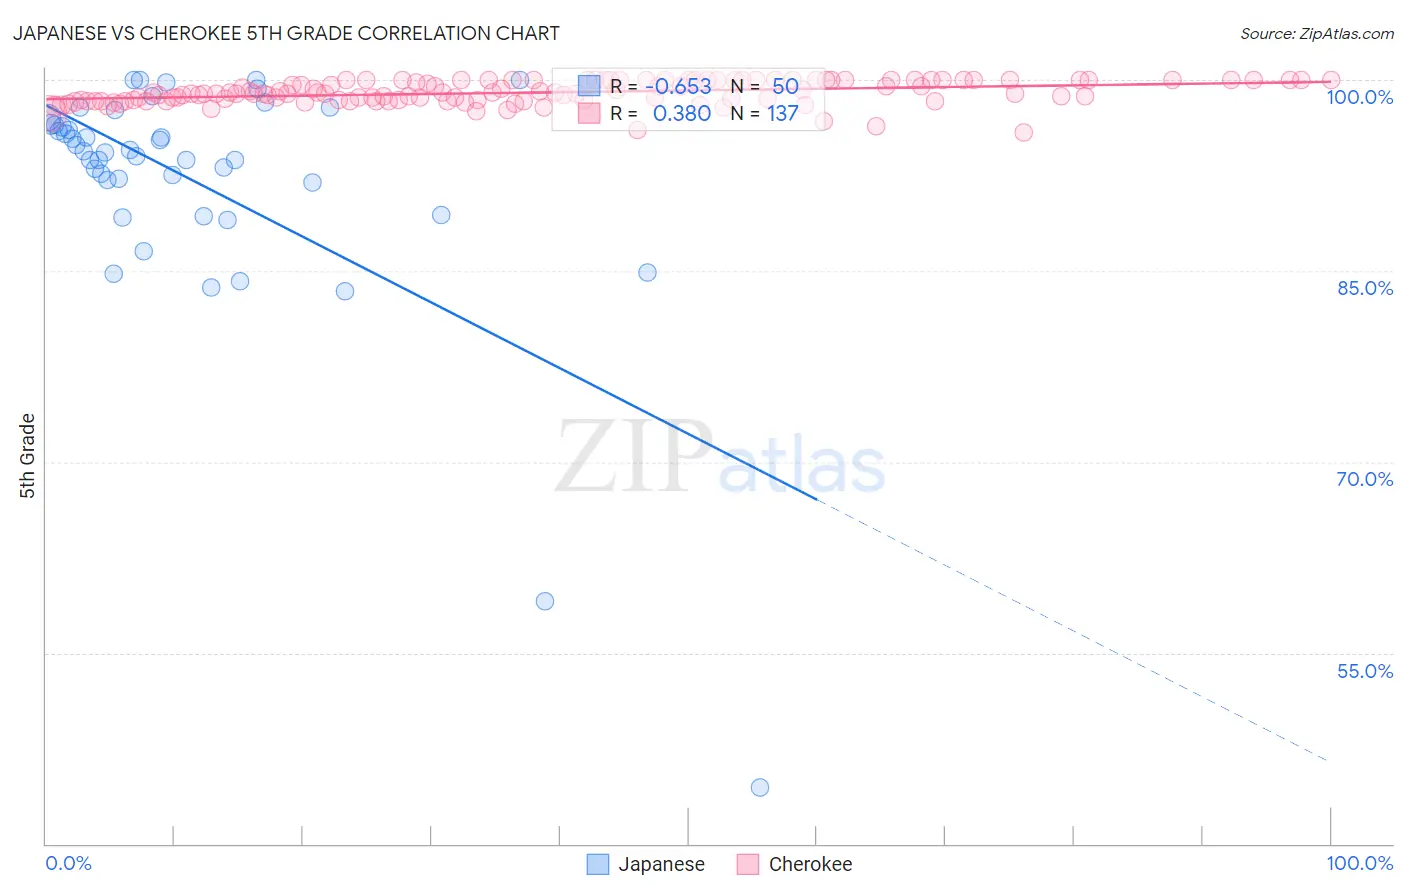
Japanese vs Cherokee 5th Grade Correlation Chart
The statistical analysis conducted on geographies consisting of 249,183,224 people shows a significant negative correlation between the proportion of Japanese and percentage of population with at least 5th grade education in the United States with a correlation coefficient (R) of -0.653 and weighted average of 95.7%. Similarly, the statistical analysis conducted on geographies consisting of 493,719,253 people shows a mild positive correlation between the proportion of Cherokee and percentage of population with at least 5th grade education in the United States with a correlation coefficient (R) of 0.380 and weighted average of 97.8%, a difference of 2.2%.
5th Grade Correlation Summary
| Measurement | Japanese | Cherokee |
| Minimum | 44.4% | 95.9% |
| Maximum | 100.0% | 100.0% |
| Range | 55.6% | 4.1% |
| Mean | 92.2% | 99.0% |
| Median | 94.4% | 98.9% |
| Interquartile 25% (IQ1) | 92.0% | 98.4% |
| Interquartile 75% (IQ3) | 96.5% | 100.0% |
| Interquartile Range (IQR) | 4.5% | 1.6% |
| Standard Deviation (Sample) | 9.6% | 0.89% |
| Standard Deviation (Population) | 9.5% | 0.88% |
Similar Demographics by 5th Grade
Demographics Similar to Japanese by 5th Grade
In terms of 5th grade, the demographic groups most similar to Japanese are Central American Indian (95.7%, a difference of 0.0%), Immigrants from Vietnam (95.8%, a difference of 0.050%), Belizean (95.8%, a difference of 0.070%), Immigrants from Belize (95.7%, a difference of 0.080%), and Immigrants from Nicaragua (95.6%, a difference of 0.090%).
| Demographics | Rating | Rank | 5th Grade |
| Vietnamese | 0.0 /100 | #312 | Tragic 95.9% |
| Bangladeshis | 0.0 /100 | #313 | Tragic 95.9% |
| Immigrants | Portugal | 0.0 /100 | #314 | Tragic 95.9% |
| Nicaraguans | 0.0 /100 | #315 | Tragic 95.9% |
| Immigrants | Ecuador | 0.0 /100 | #316 | Tragic 95.8% |
| Belizeans | 0.0 /100 | #317 | Tragic 95.8% |
| Immigrants | Vietnam | 0.0 /100 | #318 | Tragic 95.8% |
| Japanese | 0.0 /100 | #319 | Tragic 95.7% |
| Central American Indians | 0.0 /100 | #320 | Tragic 95.7% |
| Immigrants | Belize | 0.0 /100 | #321 | Tragic 95.7% |
| Immigrants | Nicaragua | 0.0 /100 | #322 | Tragic 95.6% |
| Immigrants | Fiji | 0.0 /100 | #323 | Tragic 95.6% |
| Hondurans | 0.0 /100 | #324 | Tragic 95.6% |
| Hispanics or Latinos | 0.0 /100 | #325 | Tragic 95.6% |
| Immigrants | Cambodia | 0.0 /100 | #326 | Tragic 95.5% |
Demographics Similar to Cherokee by 5th Grade
In terms of 5th grade, the demographic groups most similar to Cherokee are Lumbee (97.8%, a difference of 0.0%), Macedonian (97.9%, a difference of 0.010%), Ukrainian (97.8%, a difference of 0.010%), Immigrants from Netherlands (97.8%, a difference of 0.010%), and Immigrants from England (97.8%, a difference of 0.010%).
| Demographics | Rating | Rank | 5th Grade |
| Immigrants | Austria | 99.6 /100 | #66 | Exceptional 97.9% |
| New Zealanders | 99.6 /100 | #67 | Exceptional 97.9% |
| Cajuns | 99.6 /100 | #68 | Exceptional 97.9% |
| Kiowa | 99.5 /100 | #69 | Exceptional 97.9% |
| Iranians | 99.5 /100 | #70 | Exceptional 97.9% |
| Chickasaw | 99.5 /100 | #71 | Exceptional 97.9% |
| Macedonians | 99.4 /100 | #72 | Exceptional 97.9% |
| Cherokee | 99.4 /100 | #73 | Exceptional 97.8% |
| Lumbee | 99.3 /100 | #74 | Exceptional 97.8% |
| Ukrainians | 99.3 /100 | #75 | Exceptional 97.8% |
| Immigrants | Netherlands | 99.3 /100 | #76 | Exceptional 97.8% |
| Immigrants | England | 99.3 /100 | #77 | Exceptional 97.8% |
| Osage | 99.3 /100 | #78 | Exceptional 97.8% |
| Immigrants | Lithuania | 99.2 /100 | #79 | Exceptional 97.8% |
| Immigrants | India | 99.2 /100 | #80 | Exceptional 97.8% |