Jamaican vs Navajo 7th Grade
COMPARE
Jamaican
Navajo
7th Grade
7th Grade Comparison
Jamaicans
Navajo
95.5%
7TH GRADE
2.2/ 100
METRIC RATING
239th/ 347
METRIC RANK
95.8%
7TH GRADE
17.0/ 100
METRIC RATING
207th/ 347
METRIC RANK
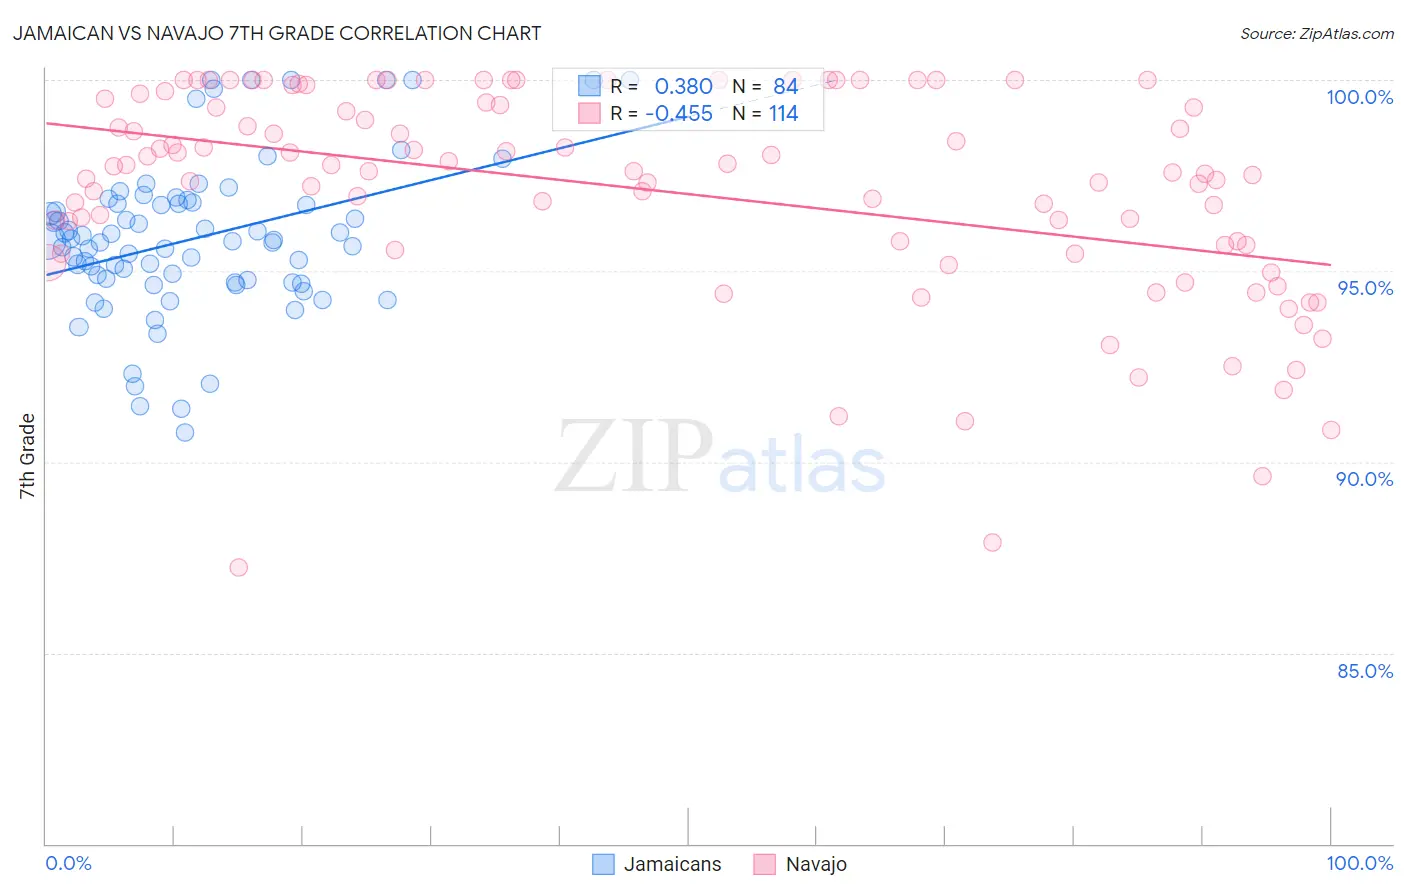
Jamaican vs Navajo 7th Grade Correlation Chart
The statistical analysis conducted on geographies consisting of 368,084,189 people shows a mild positive correlation between the proportion of Jamaicans and percentage of population with at least 7th grade education in the United States with a correlation coefficient (R) of 0.380 and weighted average of 95.5%. Similarly, the statistical analysis conducted on geographies consisting of 224,871,965 people shows a moderate negative correlation between the proportion of Navajo and percentage of population with at least 7th grade education in the United States with a correlation coefficient (R) of -0.455 and weighted average of 95.8%, a difference of 0.34%.
7th Grade Correlation Summary
| Measurement | Jamaican | Navajo |
| Minimum | 90.8% | 87.2% |
| Maximum | 100.0% | 100.0% |
| Range | 9.2% | 12.8% |
| Mean | 95.9% | 97.1% |
| Median | 95.8% | 97.6% |
| Interquartile 25% (IQ1) | 94.7% | 95.7% |
| Interquartile 75% (IQ3) | 96.8% | 99.4% |
| Interquartile Range (IQR) | 2.0% | 3.7% |
| Standard Deviation (Sample) | 2.0% | 2.8% |
| Standard Deviation (Population) | 2.0% | 2.8% |
Similar Demographics by 7th Grade
Demographics Similar to Jamaicans by 7th Grade
In terms of 7th grade, the demographic groups most similar to Jamaicans are Immigrants from Asia (95.5%, a difference of 0.010%), Indian (Asian) (95.5%, a difference of 0.010%), Immigrants from Sierra Leone (95.5%, a difference of 0.020%), South American Indian (95.5%, a difference of 0.020%), and Immigrants from Senegal (95.5%, a difference of 0.020%).
| Demographics | Rating | Rank | 7th Grade |
| Costa Ricans | 3.3 /100 | #232 | Tragic 95.5% |
| Immigrants | Indonesia | 3.3 /100 | #233 | Tragic 95.5% |
| Nigerians | 3.0 /100 | #234 | Tragic 95.5% |
| Immigrants | Africa | 2.7 /100 | #235 | Tragic 95.5% |
| Asians | 2.6 /100 | #236 | Tragic 95.5% |
| Immigrants | Asia | 2.3 /100 | #237 | Tragic 95.5% |
| Indians (Asian) | 2.3 /100 | #238 | Tragic 95.5% |
| Jamaicans | 2.2 /100 | #239 | Tragic 95.5% |
| Immigrants | Sierra Leone | 2.0 /100 | #240 | Tragic 95.5% |
| South American Indians | 2.0 /100 | #241 | Tragic 95.5% |
| Immigrants | Senegal | 1.9 /100 | #242 | Tragic 95.5% |
| U.S. Virgin Islanders | 1.6 /100 | #243 | Tragic 95.4% |
| Uruguayans | 1.6 /100 | #244 | Tragic 95.4% |
| Immigrants | Middle Africa | 1.5 /100 | #245 | Tragic 95.4% |
| Ethiopians | 1.5 /100 | #246 | Tragic 95.4% |
Demographics Similar to Navajo by 7th Grade
In terms of 7th grade, the demographic groups most similar to Navajo are Immigrants from Sudan (95.8%, a difference of 0.0%), African (95.8%, a difference of 0.010%), Dutch West Indian (95.8%, a difference of 0.010%), Hawaiian (95.8%, a difference of 0.010%), and Moroccan (95.8%, a difference of 0.020%).
| Demographics | Rating | Rank | 7th Grade |
| Argentineans | 23.2 /100 | #200 | Fair 95.9% |
| Immigrants | Argentina | 21.9 /100 | #201 | Fair 95.9% |
| Immigrants | Northern Africa | 21.4 /100 | #202 | Fair 95.8% |
| Comanche | 21.1 /100 | #203 | Fair 95.8% |
| Assyrians/Chaldeans/Syriacs | 20.5 /100 | #204 | Fair 95.8% |
| Moroccans | 18.9 /100 | #205 | Poor 95.8% |
| Africans | 17.6 /100 | #206 | Poor 95.8% |
| Navajo | 17.0 /100 | #207 | Poor 95.8% |
| Immigrants | Sudan | 17.0 /100 | #208 | Poor 95.8% |
| Dutch West Indians | 16.1 /100 | #209 | Poor 95.8% |
| Hawaiians | 16.0 /100 | #210 | Poor 95.8% |
| Portuguese | 13.6 /100 | #211 | Poor 95.8% |
| Immigrants | Lebanon | 13.0 /100 | #212 | Poor 95.8% |
| Immigrants | Morocco | 12.6 /100 | #213 | Poor 95.8% |
| Bahamians | 11.6 /100 | #214 | Poor 95.7% |