Jamaican vs Immigrants from Kazakhstan Master's Degree
COMPARE
Jamaican
Immigrants from Kazakhstan
Master's Degree
Master's Degree Comparison
Jamaicans
Immigrants from Kazakhstan
13.4%
MASTER'S DEGREE
4.1/ 100
METRIC RATING
237th/ 347
METRIC RANK
18.0%
MASTER'S DEGREE
99.8/ 100
METRIC RATING
65th/ 347
METRIC RANK
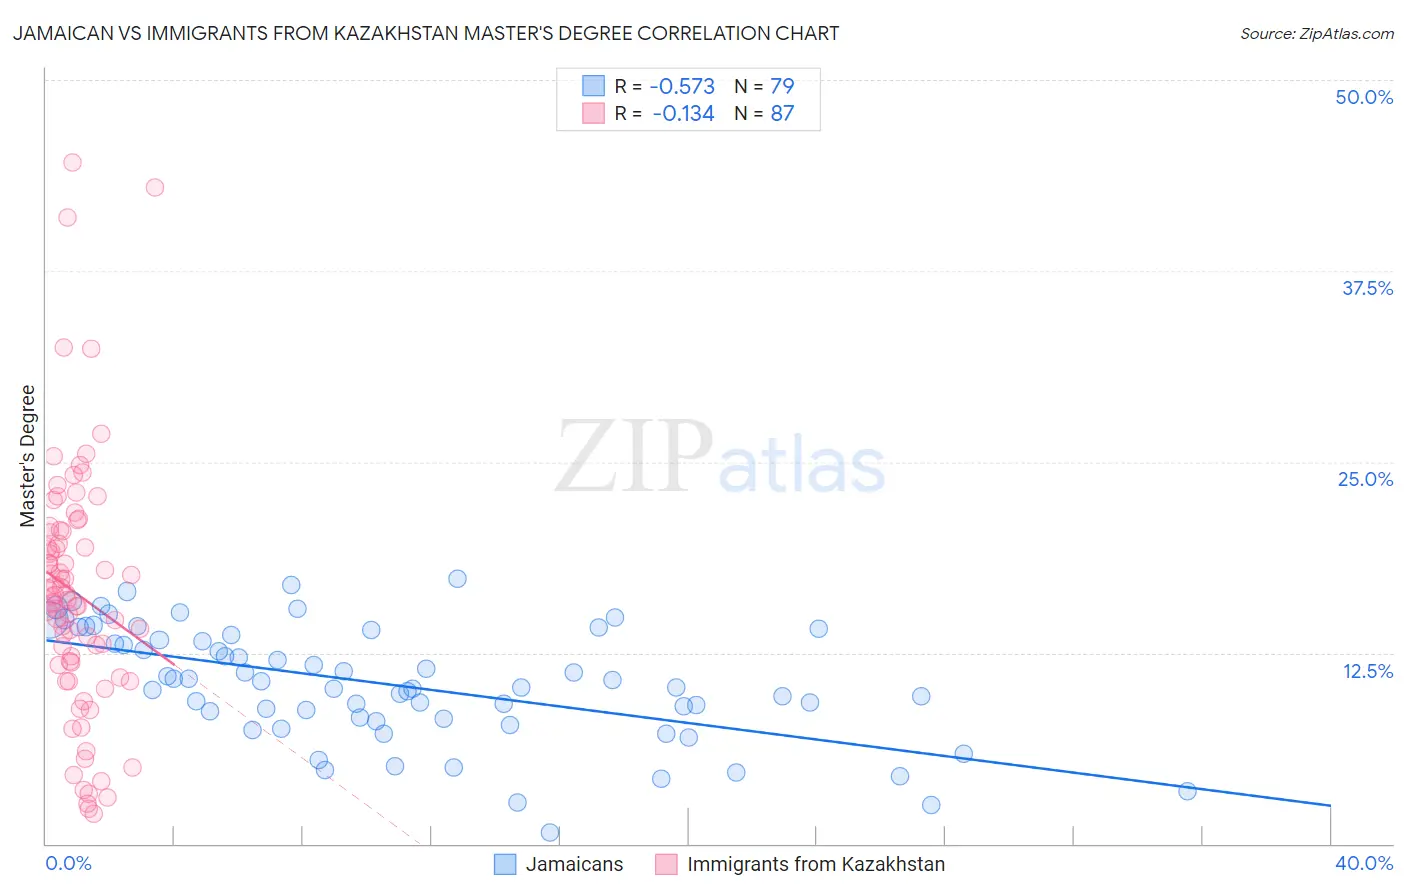
Jamaican vs Immigrants from Kazakhstan Master's Degree Correlation Chart
The statistical analysis conducted on geographies consisting of 367,857,102 people shows a substantial negative correlation between the proportion of Jamaicans and percentage of population with at least master's degree education in the United States with a correlation coefficient (R) of -0.573 and weighted average of 13.4%. Similarly, the statistical analysis conducted on geographies consisting of 124,419,458 people shows a poor negative correlation between the proportion of Immigrants from Kazakhstan and percentage of population with at least master's degree education in the United States with a correlation coefficient (R) of -0.134 and weighted average of 18.0%, a difference of 34.0%.
Master's Degree Correlation Summary
| Measurement | Jamaican | Immigrants from Kazakhstan |
| Minimum | 0.72% | 1.9% |
| Maximum | 17.3% | 44.6% |
| Range | 16.6% | 42.7% |
| Mean | 10.4% | 16.4% |
| Median | 10.2% | 16.2% |
| Interquartile 25% (IQ1) | 8.2% | 11.7% |
| Interquartile 75% (IQ3) | 13.7% | 20.5% |
| Interquartile Range (IQR) | 5.5% | 8.7% |
| Standard Deviation (Sample) | 3.8% | 8.3% |
| Standard Deviation (Population) | 3.7% | 8.2% |
Similar Demographics by Master's Degree
Demographics Similar to Jamaicans by Master's Degree
In terms of master's degree, the demographic groups most similar to Jamaicans are Hmong (13.4%, a difference of 0.14%), Immigrants from Guyana (13.4%, a difference of 0.22%), German Russian (13.5%, a difference of 0.34%), Nonimmigrants (13.3%, a difference of 0.67%), and Immigrants from Burma/Myanmar (13.5%, a difference of 0.75%).
| Demographics | Rating | Rank | Master's Degree |
| Dutch | 8.7 /100 | #230 | Tragic 13.8% |
| Guyanese | 7.6 /100 | #231 | Tragic 13.7% |
| Immigrants | Philippines | 6.0 /100 | #232 | Tragic 13.6% |
| Immigrants | Ecuador | 5.7 /100 | #233 | Tragic 13.6% |
| Immigrants | Burma/Myanmar | 5.0 /100 | #234 | Tragic 13.5% |
| German Russians | 4.5 /100 | #235 | Tragic 13.5% |
| Immigrants | Guyana | 4.4 /100 | #236 | Tragic 13.4% |
| Jamaicans | 4.1 /100 | #237 | Tragic 13.4% |
| Hmong | 4.0 /100 | #238 | Tragic 13.4% |
| Immigrants | Nonimmigrants | 3.4 /100 | #239 | Tragic 13.3% |
| Guamanians/Chamorros | 2.2 /100 | #240 | Tragic 13.1% |
| U.S. Virgin Islanders | 2.1 /100 | #241 | Tragic 13.1% |
| Spanish Americans | 1.9 /100 | #242 | Tragic 13.0% |
| Immigrants | Jamaica | 1.9 /100 | #243 | Tragic 13.0% |
| Delaware | 1.7 /100 | #244 | Tragic 13.0% |
Demographics Similar to Immigrants from Kazakhstan by Master's Degree
In terms of master's degree, the demographic groups most similar to Immigrants from Kazakhstan are Ethiopian (18.0%, a difference of 0.020%), Immigrants from Argentina (18.0%, a difference of 0.070%), Immigrants from Ethiopia (17.9%, a difference of 0.30%), Immigrants from Uzbekistan (17.9%, a difference of 0.62%), and South African (18.1%, a difference of 0.70%).
| Demographics | Rating | Rank | Master's Degree |
| Australians | 99.9 /100 | #58 | Exceptional 18.4% |
| Immigrants | Bulgaria | 99.9 /100 | #59 | Exceptional 18.3% |
| New Zealanders | 99.9 /100 | #60 | Exceptional 18.3% |
| Immigrants | Europe | 99.9 /100 | #61 | Exceptional 18.2% |
| Argentineans | 99.9 /100 | #62 | Exceptional 18.2% |
| Immigrants | Netherlands | 99.9 /100 | #63 | Exceptional 18.1% |
| South Africans | 99.9 /100 | #64 | Exceptional 18.1% |
| Immigrants | Kazakhstan | 99.8 /100 | #65 | Exceptional 18.0% |
| Ethiopians | 99.8 /100 | #66 | Exceptional 18.0% |
| Immigrants | Argentina | 99.8 /100 | #67 | Exceptional 18.0% |
| Immigrants | Ethiopia | 99.8 /100 | #68 | Exceptional 17.9% |
| Immigrants | Uzbekistan | 99.8 /100 | #69 | Exceptional 17.9% |
| Immigrants | Western Europe | 99.8 /100 | #70 | Exceptional 17.8% |
| Immigrants | Pakistan | 99.7 /100 | #71 | Exceptional 17.8% |
| Lithuanians | 99.7 /100 | #72 | Exceptional 17.7% |