Jamaican vs Immigrants from Eastern Africa Associate's Degree

COMPARE

Jamaican
Race
Ancestry
AfghanAfricanAlaska NativeAlaskan AthabascanAlbanianAleutAlsatianAmericanApacheArabArapahoArgentineanArmenianAssyrian/Chaldean/SyriacAustralianAustrianBahamianBangladeshiBarbadianBasqueBelgianBelizeanBermudanBhutaneseBlackfeetBolivianBrazilianBritishBritish West IndianBulgarianBurmeseCajunCambodianCanadianCape VerdeanCarpatho RusynCelticCentral AmericanCentral American IndianCherokeeCheyenneChickasawChileanChineseChippewaChoctawColombianColvilleComancheCosta RicanCreeCreekCroatianCrowCubanCypriotCzechCzechoslovakianDanishDelawareDominicanDutchDutch West IndianEastern EuropeanEcuadorianEgyptianEnglishEstonianEthiopianEuropeanFijianFilipinoFinnishFrenchFrench American IndianFrench CanadianGermanGerman RussianGhanaianGreekGuamanian/ChamorroGuatemalanGuyaneseHaitianHmongHonduranHopiHoumaHungarianIcelanderIndian (Asian)IndonesianInupiatIranianIraqiIrishIroquoisIsraeliItalianJamaicanJapaneseJordanianKenyanKiowaKoreanLaotianLatvianLebaneseLiberianLithuanianLumbeeLuxembourgerMacedonianMalaysianMalteseMarshalleseMenomineeMexicanMexican American IndianMongolianMoroccanNative HawaiianNavajoNepaleseNew ZealanderNicaraguanNigerianNorthern EuropeanNorwegianOkinawanOsageOttawaPaiutePakistaniPalestinianPanamanianParaguayanPennsylvania GermanPeruvianPimaPolishPortuguesePotawatomiPuebloPuerto RicanPuget Sound SalishRomanianRussianSalvadoranSamoanScandinavianScotch-IrishScottishSeminoleSenegaleseSerbianShoshoneSierra LeoneanSiouxSlavicSlovakSloveneSomaliSouth AfricanSouth AmericanSouth American IndianSoviet UnionSpaniardSpanishSpanish AmericanSpanish American IndianSri LankanSubsaharan AfricanSudaneseSwedishSwissSyrianTaiwaneseThaiTlingit-HaidaTohono O'OdhamTonganTrinidadian and TobagonianTsimshianTurkishU.S. Virgin IslanderUgandanUkrainianUruguayanUteVenezuelanVietnameseWelshWest IndianYakamaYaquiYugoslavianYumanYup'ikZimbabwean
Immigration
NonimmigrantsImmigrantsAfghanistanAfricaAlbaniaArgentinaArmeniaAsiaAustraliaAustriaBahamasBangladeshBarbadosBelarusBelgiumBelizeBoliviaBosnia and HerzegovinaBrazilBulgariaBurma/MyanmarCabo VerdeCambodiaCameroonCanadaCaribbeanCentral AmericaChileChinaColombiaCongoCosta RicaCroatiaCubaCzechoslovakiaDenmarkDominicaDominican RepublicEastern AsiaEastern EuropeEcuadorEgyptEl SalvadorEnglandEritreaEthiopiaEuropeFijiFranceGermanyGhanaGreeceGrenadaGuatemalaGuyanaHaitiHondurasHong KongHungaryIndiaIndonesiaIranIraqIrelandIsraelItalyJamaicaJapanJordanKazakhstanKenyaKoreaKuwaitLaosLatin AmericaLatviaLebanonLiberiaLithuaniaMalaysiaMexicoMicronesiaMiddle AfricaMoldovaMoroccoNepalNetherlandsNicaraguaNigeriaNorth AmericaNorth MacedoniaNorthern AfricaNorthern EuropeNorwayOceaniaPakistanPanamaPeruPhilippinesPolandPortugalRomaniaRussiaSaudi ArabiaScotlandSenegalSerbiaSierra LeoneSingaporeSomaliaSouth AfricaSouth AmericaSouth Central AsiaSouth Eastern AsiaSouthern EuropeSpainSri LankaSt. Vincent and the GrenadinesSudanSwedenSwitzerlandSyriaTaiwanThailandTrinidad and TobagoTurkeyUgandaUkraineUruguayUzbekistanVenezuelaVietnamWest IndiesWestern AfricaWestern AsiaWestern EuropeYemenZaireZimbabweAzores
Immigrants from Eastern Africa
Race
Ancestry
AfghanAfricanAlaska NativeAlaskan AthabascanAlbanianAleutAlsatianAmericanApacheArabArapahoArgentineanArmenianAssyrian/Chaldean/SyriacAustralianAustrianBahamianBangladeshiBarbadianBasqueBelgianBelizeanBermudanBhutaneseBlackfeetBolivianBrazilianBritishBritish West IndianBulgarianBurmeseCajunCambodianCanadianCape VerdeanCarpatho RusynCelticCentral AmericanCentral American IndianCherokeeCheyenneChickasawChileanChineseChippewaChoctawColombianColvilleComancheCosta RicanCreeCreekCroatianCrowCubanCypriotCzechCzechoslovakianDanishDelawareDominicanDutchDutch West IndianEastern EuropeanEcuadorianEgyptianEnglishEstonianEthiopianEuropeanFijianFilipinoFinnishFrenchFrench American IndianFrench CanadianGermanGerman RussianGhanaianGreekGuamanian/ChamorroGuatemalanGuyaneseHaitianHmongHonduranHopiHoumaHungarianIcelanderIndian (Asian)IndonesianInupiatIranianIraqiIrishIroquoisIsraeliItalianJapaneseJordanianKenyanKiowaKoreanLaotianLatvianLebaneseLiberianLithuanianLumbeeLuxembourgerMacedonianMalaysianMalteseMarshalleseMenomineeMexicanMexican American IndianMongolianMoroccanNative HawaiianNavajoNepaleseNew ZealanderNicaraguanNigerianNorthern EuropeanNorwegianOkinawanOsageOttawaPaiutePakistaniPalestinianPanamanianParaguayanPennsylvania GermanPeruvianPimaPolishPortuguesePotawatomiPuebloPuerto RicanPuget Sound SalishRomanianRussianSalvadoranSamoanScandinavianScotch-IrishScottishSeminoleSenegaleseSerbianShoshoneSierra LeoneanSiouxSlavicSlovakSloveneSomaliSouth AfricanSouth AmericanSouth American IndianSoviet UnionSpaniardSpanishSpanish AmericanSpanish American IndianSri LankanSubsaharan AfricanSudaneseSwedishSwissSyrianTaiwaneseThaiTlingit-HaidaTohono O'OdhamTonganTrinidadian and TobagonianTsimshianTurkishU.S. Virgin IslanderUgandanUkrainianUruguayanUteVenezuelanVietnameseWelshWest IndianYakamaYaquiYugoslavianYumanYup'ikZimbabwean
Immigration
NonimmigrantsImmigrantsAfghanistanAfricaAlbaniaArgentinaArmeniaAsiaAustraliaAustriaBahamasBangladeshBarbadosBelarusBelgiumBelizeBoliviaBosnia and HerzegovinaBrazilBulgariaBurma/MyanmarCabo VerdeCambodiaCameroonCanadaCaribbeanCentral AmericaChileChinaColombiaCongoCosta RicaCroatiaCubaCzechoslovakiaDenmarkDominicaDominican RepublicEastern AfricaEastern AsiaEastern EuropeEcuadorEgyptEl SalvadorEnglandEritreaEthiopiaEuropeFijiFranceGermanyGhanaGreeceGrenadaGuatemalaGuyanaHaitiHondurasHong KongHungaryIndiaIndonesiaIranIraqIrelandIsraelItalyJamaicaJapanJordanKazakhstanKenyaKoreaKuwaitLaosLatin AmericaLatviaLebanonLiberiaLithuaniaMalaysiaMexicoMicronesiaMiddle AfricaMoldovaMoroccoNepalNetherlandsNicaraguaNigeriaNorth AmericaNorth MacedoniaNorthern AfricaNorthern EuropeNorwayOceaniaPakistanPanamaPeruPhilippinesPolandPortugalRomaniaRussiaSaudi ArabiaScotlandSenegalSerbiaSierra LeoneSingaporeSomaliaSouth AfricaSouth AmericaSouth Central AsiaSouth Eastern AsiaSouthern EuropeSpainSri LankaSt. Vincent and the GrenadinesSudanSwedenSwitzerlandSyriaTaiwanThailandTrinidad and TobagoTurkeyUgandaUkraineUruguayUzbekistanVenezuelaVietnamWest IndiesWestern AfricaWestern AsiaWestern EuropeYemenZaireZimbabweAzores
Associate's Degree
Income
Poverty
Unemployment
Labor Participation
Family Structure
Vehicle Availability
Education Level
Disability

Associate's Degree Comparison

Jamaicans

Immigrants from Eastern Africa

Tragic
Exceptional
42.1%
ASSOCIATE'S DEGREE
0.7/ 100
METRIC RATING
249th/ 347
METRIC RANK
48.4%
ASSOCIATE'S DEGREE
91.6/ 100
METRIC RATING
128th/ 347
METRIC RANK

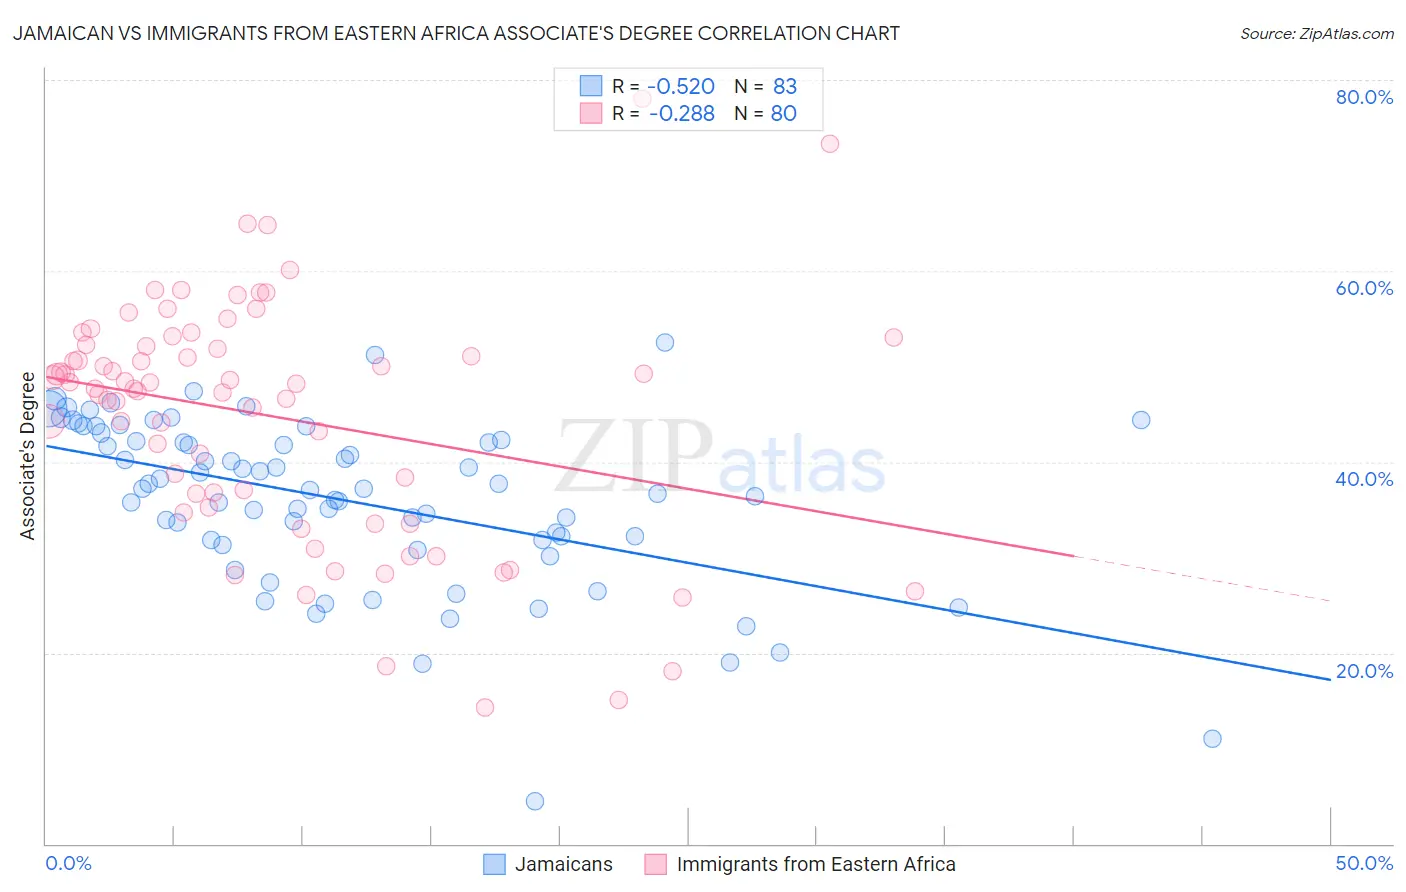
Jamaican vs Immigrants from Eastern Africa Associate's Degree Correlation Chart

The statistical analysis conducted on geographies consisting of 368,030,405 people shows a substantial negative correlation between the proportion of Jamaicans and percentage of population with at least associate's degree education in the United States with a correlation coefficient (R) of -0.520 and weighted average of 42.1%. Similarly, the statistical analysis conducted on geographies consisting of 355,139,091 people shows a weak negative correlation between the proportion of Immigrants from Eastern Africa and percentage of population with at least associate's degree education in the United States with a correlation coefficient (R) of -0.288 and weighted average of 48.4%, a difference of 15.0%.
Jamaican vs Immigrants from Eastern Africa Associate's Degree

Associate's Degree Correlation Summary

MeasurementJamaicanImmigrants from Eastern Africa
Minimum4.5%14.3%
Maximum52.5%78.0%
Range48.0%63.7%
Mean36.0%44.8%
Median37.1%47.9%
Interquartile 25% (IQ1)31.8%35.9%
Interquartile 75% (IQ3)42.2%52.2%
Interquartile Range (IQR)10.4%16.2%
Standard Deviation (Sample)8.8%12.5%
Standard Deviation (Population)8.8%12.4%

Similar Demographics by Associate's Degree

Demographics Similar to Jamaicans by Associate's Degree

In terms of associate's degree, the demographic groups most similar to Jamaicans are U.S. Virgin Islander (42.1%, a difference of 0.010%), Immigrants from Bahamas (42.1%, a difference of 0.030%), Immigrants from Ecuador (42.2%, a difference of 0.14%), Immigrants from Fiji (42.2%, a difference of 0.23%), and Delaware (42.3%, a difference of 0.32%).
DemographicsRating | RankAssociate's Degree
Immigrants | West Indies
1.0
/100
|
#242
Tragic
42.4%
Guyanese
1.0
/100
|
#243
Tragic
42.3%
Immigrants | Liberia
0.9
/100
|
#244
Tragic
42.3%
Immigrants | Cambodia
0.9
/100
|
#245
Tragic
42.3%
Delaware
0.9
/100
|
#246
Tragic
42.3%
Immigrants | Fiji
0.8
/100
|
#247
Tragic
42.2%
Immigrants | Ecuador
0.8
/100
|
#248
Tragic
42.2%
Jamaicans
0.7
/100
|
#249
Tragic
42.1%
U.S. Virgin Islanders
0.7
/100
|
#250
Tragic
42.1%
Immigrants | Bahamas
0.7
/100
|
#251
Tragic
42.1%
French American Indians
0.6
/100
|
#252
Tragic
42.0%
Indonesians
0.6
/100
|
#253
Tragic
41.9%
Cubans
0.6
/100
|
#254
Tragic
41.9%
Immigrants | Guyana
0.5
/100
|
#255
Tragic
41.8%
Immigrants | Congo
0.5
/100
|
#256
Tragic
41.8%

Demographics Similar to Immigrants from Eastern Africa by Associate's Degree

In terms of associate's degree, the demographic groups most similar to Immigrants from Eastern Africa are Swedish (48.4%, a difference of 0.030%), Immigrants from Jordan (48.4%, a difference of 0.090%), Immigrants from Uganda (48.5%, a difference of 0.12%), Immigrants from Syria (48.5%, a difference of 0.13%), and Icelander (48.3%, a difference of 0.19%).
DemographicsRating | RankAssociate's Degree
Ugandans
93.9
/100
|
#121
Exceptional
48.7%
Italians
93.9
/100
|
#122
Exceptional
48.7%
Brazilians
93.7
/100
|
#123
Exceptional
48.7%
Serbians
92.6
/100
|
#124
Exceptional
48.5%
Chinese
92.5
/100
|
#125
Exceptional
48.5%
Immigrants | Syria
92.2
/100
|
#126
Exceptional
48.5%
Immigrants | Uganda
92.1
/100
|
#127
Exceptional
48.5%
Immigrants | Eastern Africa
91.6
/100
|
#128
Exceptional
48.4%
Swedes
91.5
/100
|
#129
Exceptional
48.4%
Immigrants | Jordan
91.2
/100
|
#130
Exceptional
48.4%
Icelanders
90.8
/100
|
#131
Exceptional
48.3%
Immigrants | Albania
89.9
/100
|
#132
Excellent
48.2%
Assyrians/Chaldeans/Syriacs
89.4
/100
|
#133
Excellent
48.2%
Moroccans
89.3
/100
|
#134
Excellent
48.2%
Europeans
89.0
/100
|
#135
Excellent
48.2%