Italian vs Tongan Associate's Degree
COMPARE
Italian
Tongan
Associate's Degree
Associate's Degree Comparison
Italians
Tongans
48.7%
ASSOCIATE'S DEGREE
93.9/ 100
METRIC RATING
122nd/ 347
METRIC RANK
43.0%
ASSOCIATE'S DEGREE
2.2/ 100
METRIC RATING
233rd/ 347
METRIC RANK
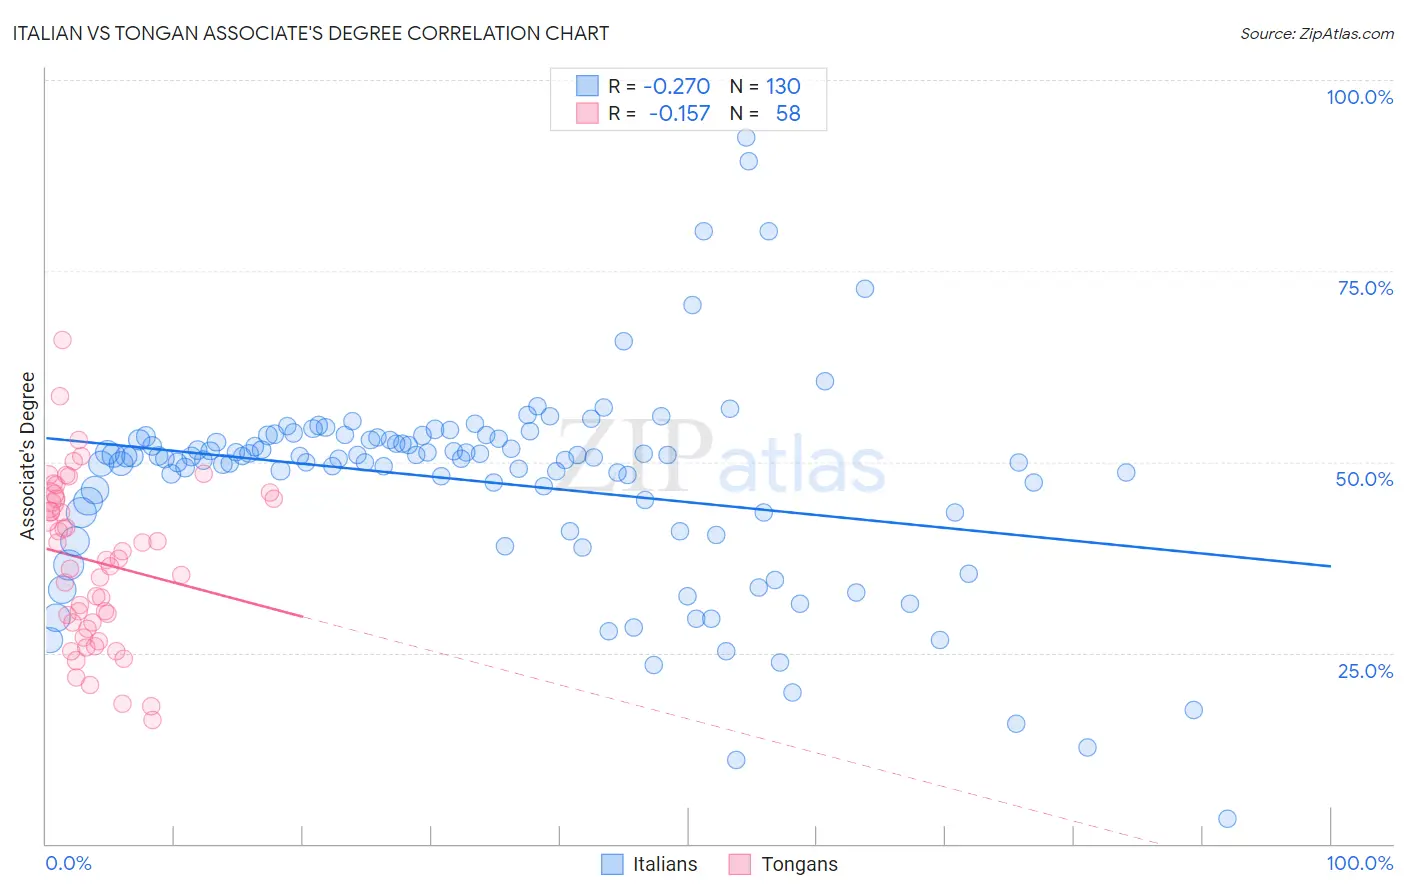
Italian vs Tongan Associate's Degree Correlation Chart
The statistical analysis conducted on geographies consisting of 575,016,726 people shows a weak negative correlation between the proportion of Italians and percentage of population with at least associate's degree education in the United States with a correlation coefficient (R) of -0.270 and weighted average of 48.7%. Similarly, the statistical analysis conducted on geographies consisting of 102,908,759 people shows a poor negative correlation between the proportion of Tongans and percentage of population with at least associate's degree education in the United States with a correlation coefficient (R) of -0.157 and weighted average of 43.0%, a difference of 13.2%.
Associate's Degree Correlation Summary
| Measurement | Italian | Tongan |
| Minimum | 3.2% | 16.2% |
| Maximum | 92.5% | 65.9% |
| Range | 89.3% | 49.7% |
| Mean | 47.4% | 37.0% |
| Median | 50.6% | 37.2% |
| Interquartile 25% (IQ1) | 43.4% | 28.9% |
| Interquartile 75% (IQ3) | 53.1% | 45.1% |
| Interquartile Range (IQR) | 9.7% | 16.2% |
| Standard Deviation (Sample) | 13.4% | 10.6% |
| Standard Deviation (Population) | 13.4% | 10.5% |
Similar Demographics by Associate's Degree
Demographics Similar to Italians by Associate's Degree
In terms of associate's degree, the demographic groups most similar to Italians are Ugandan (48.7%, a difference of 0.0%), Brazilian (48.7%, a difference of 0.060%), Alsatian (48.8%, a difference of 0.23%), Lebanese (48.8%, a difference of 0.25%), and Albanian (48.8%, a difference of 0.26%).
| Demographics | Rating | Rank | Associate's Degree |
| Luxembourgers | 95.1 /100 | #115 | Exceptional 48.9% |
| British | 95.0 /100 | #116 | Exceptional 48.9% |
| Afghans | 94.8 /100 | #117 | Exceptional 48.9% |
| Albanians | 94.7 /100 | #118 | Exceptional 48.8% |
| Lebanese | 94.6 /100 | #119 | Exceptional 48.8% |
| Alsatians | 94.6 /100 | #120 | Exceptional 48.8% |
| Ugandans | 93.9 /100 | #121 | Exceptional 48.7% |
| Italians | 93.9 /100 | #122 | Exceptional 48.7% |
| Brazilians | 93.7 /100 | #123 | Exceptional 48.7% |
| Serbians | 92.6 /100 | #124 | Exceptional 48.5% |
| Chinese | 92.5 /100 | #125 | Exceptional 48.5% |
| Immigrants | Syria | 92.2 /100 | #126 | Exceptional 48.5% |
| Immigrants | Uganda | 92.1 /100 | #127 | Exceptional 48.5% |
| Immigrants | Eastern Africa | 91.6 /100 | #128 | Exceptional 48.4% |
| Swedes | 91.5 /100 | #129 | Exceptional 48.4% |
Demographics Similar to Tongans by Associate's Degree
In terms of associate's degree, the demographic groups most similar to Tongans are Tlingit-Haida (43.0%, a difference of 0.090%), Native Hawaiian (43.1%, a difference of 0.16%), Ecuadorian (43.0%, a difference of 0.19%), Immigrants from St. Vincent and the Grenadines (42.9%, a difference of 0.27%), and Nonimmigrants (42.9%, a difference of 0.29%).
| Demographics | Rating | Rank | Associate's Degree |
| Immigrants | Burma/Myanmar | 4.3 /100 | #226 | Tragic 43.7% |
| Trinidadians and Tobagonians | 4.0 /100 | #227 | Tragic 43.6% |
| Hmong | 3.2 /100 | #228 | Tragic 43.4% |
| Immigrants | Trinidad and Tobago | 3.0 /100 | #229 | Tragic 43.3% |
| Immigrants | Barbados | 2.9 /100 | #230 | Tragic 43.3% |
| Liberians | 2.9 /100 | #231 | Tragic 43.3% |
| Native Hawaiians | 2.3 /100 | #232 | Tragic 43.1% |
| Tongans | 2.2 /100 | #233 | Tragic 43.0% |
| Tlingit-Haida | 2.1 /100 | #234 | Tragic 43.0% |
| Ecuadorians | 2.0 /100 | #235 | Tragic 43.0% |
| Immigrants | St. Vincent and the Grenadines | 1.9 /100 | #236 | Tragic 42.9% |
| Immigrants | Nonimmigrants | 1.9 /100 | #237 | Tragic 42.9% |
| Iroquois | 1.7 /100 | #238 | Tragic 42.8% |
| Immigrants | Grenada | 1.3 /100 | #239 | Tragic 42.6% |
| Cree | 1.2 /100 | #240 | Tragic 42.5% |