Italian vs Immigrants from Germany 9th Grade

COMPARE

Italian
Race
Ancestry
AfghanAfricanAlaska NativeAlaskan AthabascanAlbanianAleutAlsatianAmericanApacheArabArapahoArgentineanArmenianAssyrian/Chaldean/SyriacAustralianAustrianBahamianBangladeshiBarbadianBasqueBelgianBelizeanBermudanBhutaneseBlackfeetBolivianBrazilianBritishBritish West IndianBulgarianBurmeseCajunCambodianCanadianCape VerdeanCarpatho RusynCelticCentral AmericanCentral American IndianCherokeeCheyenneChickasawChileanChineseChippewaChoctawColombianColvilleComancheCosta RicanCreeCreekCroatianCrowCubanCypriotCzechCzechoslovakianDanishDelawareDominicanDutchDutch West IndianEastern EuropeanEcuadorianEgyptianEnglishEstonianEthiopianEuropeanFijianFilipinoFinnishFrenchFrench American IndianFrench CanadianGermanGerman RussianGhanaianGreekGuamanian/ChamorroGuatemalanGuyaneseHaitianHmongHonduranHopiHoumaHungarianIcelanderIndian (Asian)IndonesianInupiatIranianIraqiIrishIroquoisIsraeliItalianJamaicanJapaneseJordanianKenyanKiowaKoreanLaotianLatvianLebaneseLiberianLithuanianLumbeeLuxembourgerMacedonianMalaysianMalteseMarshalleseMenomineeMexicanMexican American IndianMongolianMoroccanNative HawaiianNavajoNepaleseNew ZealanderNicaraguanNigerianNorthern EuropeanNorwegianOkinawanOsageOttawaPaiutePakistaniPalestinianPanamanianParaguayanPennsylvania GermanPeruvianPimaPolishPortuguesePotawatomiPuebloPuerto RicanPuget Sound SalishRomanianRussianSalvadoranSamoanScandinavianScotch-IrishScottishSeminoleSenegaleseSerbianShoshoneSierra LeoneanSiouxSlavicSlovakSloveneSomaliSouth AfricanSouth AmericanSouth American IndianSoviet UnionSpaniardSpanishSpanish AmericanSpanish American IndianSri LankanSubsaharan AfricanSudaneseSwedishSwissSyrianTaiwaneseThaiTlingit-HaidaTohono O'OdhamTonganTrinidadian and TobagonianTsimshianTurkishU.S. Virgin IslanderUgandanUkrainianUruguayanUteVenezuelanVietnameseWelshWest IndianYakamaYaquiYugoslavianYumanYup'ikZimbabwean
Immigration
NonimmigrantsImmigrantsAfghanistanAfricaAlbaniaArgentinaArmeniaAsiaAustraliaAustriaBahamasBangladeshBarbadosBelarusBelgiumBelizeBoliviaBosnia and HerzegovinaBrazilBulgariaBurma/MyanmarCabo VerdeCambodiaCameroonCanadaCaribbeanCentral AmericaChileChinaColombiaCongoCosta RicaCroatiaCubaCzechoslovakiaDenmarkDominicaDominican RepublicEastern AfricaEastern AsiaEastern EuropeEcuadorEgyptEl SalvadorEnglandEritreaEthiopiaEuropeFijiFranceGhanaGreeceGrenadaGuatemalaGuyanaHaitiHondurasHong KongHungaryIndiaIndonesiaIranIraqIrelandIsraelItalyJamaicaJapanJordanKazakhstanKenyaKoreaKuwaitLaosLatin AmericaLatviaLebanonLiberiaLithuaniaMalaysiaMexicoMicronesiaMiddle AfricaMoldovaMoroccoNepalNetherlandsNicaraguaNigeriaNorth AmericaNorth MacedoniaNorthern AfricaNorthern EuropeNorwayOceaniaPakistanPanamaPeruPhilippinesPolandPortugalRomaniaRussiaSaudi ArabiaScotlandSenegalSerbiaSierra LeoneSingaporeSomaliaSouth AfricaSouth AmericaSouth Central AsiaSouth Eastern AsiaSouthern EuropeSpainSri LankaSt. Vincent and the GrenadinesSudanSwedenSwitzerlandSyriaTaiwanThailandTrinidad and TobagoTurkeyUgandaUkraineUruguayUzbekistanVenezuelaVietnamWest IndiesWestern AfricaWestern AsiaWestern EuropeYemenZaireZimbabweAzores
Immigrants from Germany
Race
Ancestry
AfghanAfricanAlaska NativeAlaskan AthabascanAlbanianAleutAlsatianAmericanApacheArabArapahoArgentineanArmenianAssyrian/Chaldean/SyriacAustralianAustrianBahamianBangladeshiBarbadianBasqueBelgianBelizeanBermudanBhutaneseBlackfeetBolivianBrazilianBritishBritish West IndianBulgarianBurmeseCajunCambodianCanadianCape VerdeanCarpatho RusynCelticCentral AmericanCentral American IndianCherokeeCheyenneChickasawChileanChineseChippewaChoctawColombianColvilleComancheCosta RicanCreeCreekCroatianCrowCubanCypriotCzechCzechoslovakianDanishDelawareDominicanDutchDutch West IndianEastern EuropeanEcuadorianEgyptianEnglishEstonianEthiopianEuropeanFijianFilipinoFinnishFrenchFrench American IndianFrench CanadianGermanGerman RussianGhanaianGreekGuamanian/ChamorroGuatemalanGuyaneseHaitianHmongHonduranHopiHoumaHungarianIcelanderIndian (Asian)IndonesianInupiatIranianIraqiIrishIroquoisIsraeliJamaicanJapaneseJordanianKenyanKiowaKoreanLaotianLatvianLebaneseLiberianLithuanianLumbeeLuxembourgerMacedonianMalaysianMalteseMarshalleseMenomineeMexicanMexican American IndianMongolianMoroccanNative HawaiianNavajoNepaleseNew ZealanderNicaraguanNigerianNorthern EuropeanNorwegianOkinawanOsageOttawaPaiutePakistaniPalestinianPanamanianParaguayanPennsylvania GermanPeruvianPimaPolishPortuguesePotawatomiPuebloPuerto RicanPuget Sound SalishRomanianRussianSalvadoranSamoanScandinavianScotch-IrishScottishSeminoleSenegaleseSerbianShoshoneSierra LeoneanSiouxSlavicSlovakSloveneSomaliSouth AfricanSouth AmericanSouth American IndianSoviet UnionSpaniardSpanishSpanish AmericanSpanish American IndianSri LankanSubsaharan AfricanSudaneseSwedishSwissSyrianTaiwaneseThaiTlingit-HaidaTohono O'OdhamTonganTrinidadian and TobagonianTsimshianTurkishU.S. Virgin IslanderUgandanUkrainianUruguayanUteVenezuelanVietnameseWelshWest IndianYakamaYaquiYugoslavianYumanYup'ikZimbabwean
Immigration
NonimmigrantsImmigrantsAfghanistanAfricaAlbaniaArgentinaArmeniaAsiaAustraliaAustriaBahamasBangladeshBarbadosBelarusBelgiumBelizeBoliviaBosnia and HerzegovinaBrazilBulgariaBurma/MyanmarCabo VerdeCambodiaCameroonCanadaCaribbeanCentral AmericaChileChinaColombiaCongoCosta RicaCroatiaCubaCzechoslovakiaDenmarkDominicaDominican RepublicEastern AfricaEastern AsiaEastern EuropeEcuadorEgyptEl SalvadorEnglandEritreaEthiopiaEuropeFijiFranceGermanyGhanaGreeceGrenadaGuatemalaGuyanaHaitiHondurasHong KongHungaryIndiaIndonesiaIranIraqIrelandIsraelItalyJamaicaJapanJordanKazakhstanKenyaKoreaKuwaitLaosLatin AmericaLatviaLebanonLiberiaLithuaniaMalaysiaMexicoMicronesiaMiddle AfricaMoldovaMoroccoNepalNetherlandsNicaraguaNigeriaNorth AmericaNorth MacedoniaNorthern AfricaNorthern EuropeNorwayOceaniaPakistanPanamaPeruPhilippinesPolandPortugalRomaniaRussiaSaudi ArabiaScotlandSenegalSerbiaSierra LeoneSingaporeSomaliaSouth AfricaSouth AmericaSouth Central AsiaSouth Eastern AsiaSouthern EuropeSpainSri LankaSt. Vincent and the GrenadinesSudanSwedenSwitzerlandSyriaTaiwanThailandTrinidad and TobagoTurkeyUgandaUkraineUruguayUzbekistanVenezuelaVietnamWest IndiesWestern AfricaWestern AsiaWestern EuropeYemenZaireZimbabweAzores
9th Grade
Income
Poverty
Unemployment
Labor Participation
Family Structure
Vehicle Availability
Education Level
Disability

9th Grade Comparison

Italians

Immigrants from Germany

Exceptional
Exceptional
96.4%
9TH GRADE
100.0/ 100
METRIC RATING
20th/ 347
METRIC RANK
95.6%
9TH GRADE
98.7/ 100
METRIC RATING
93rd/ 347
METRIC RANK

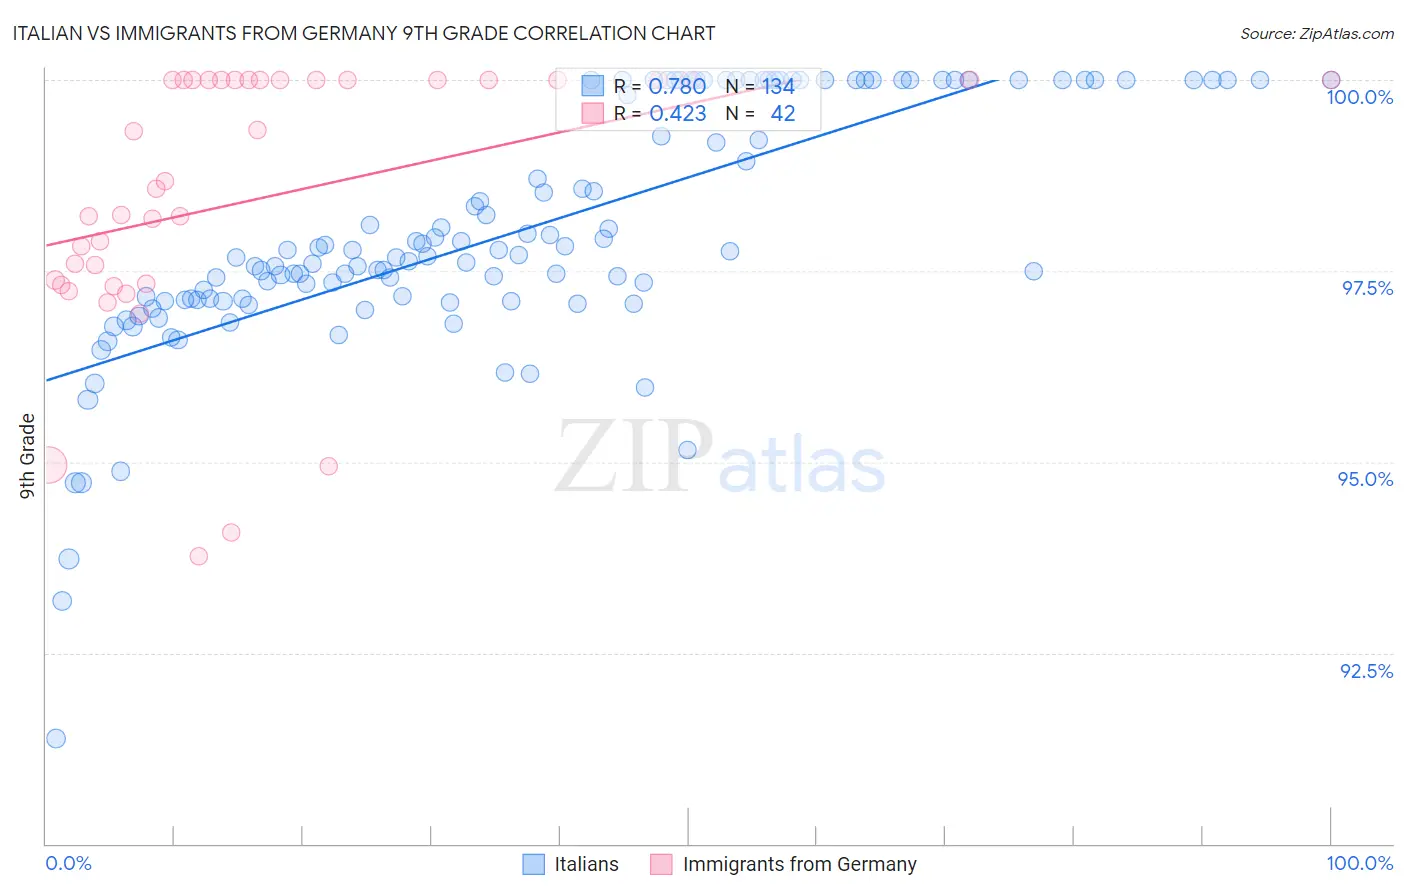
Italian vs Immigrants from Germany 9th Grade Correlation Chart

The statistical analysis conducted on geographies consisting of 546,284,153 people shows a strong positive correlation between the proportion of Italians and percentage of population with at least 9th grade education in the United States with a correlation coefficient (R) of 0.780 and weighted average of 96.4%. Similarly, the statistical analysis conducted on geographies consisting of 463,886,920 people shows a moderate positive correlation between the proportion of Immigrants from Germany and percentage of population with at least 9th grade education in the United States with a correlation coefficient (R) of 0.423 and weighted average of 95.6%, a difference of 0.82%.
Italian vs Immigrants from Germany 9th Grade

9th Grade Correlation Summary

MeasurementItalianImmigrants from Germany
Minimum91.4%93.8%
Maximum100.0%100.0%
Range8.6%6.2%
Mean98.0%98.5%
Median97.7%98.6%
Interquartile 25% (IQ1)97.1%97.3%
Interquartile 75% (IQ3)100.0%100.0%
Interquartile Range (IQR)2.9%2.7%
Standard Deviation (Sample)1.6%1.7%
Standard Deviation (Population)1.6%1.7%

Similar Demographics by 9th Grade

Demographics Similar to Italians by 9th Grade

In terms of 9th grade, the demographic groups most similar to Italians are Welsh (96.4%, a difference of 0.0%), Alaskan Athabascan (96.4%, a difference of 0.010%), European (96.4%, a difference of 0.020%), Scandinavian (96.5%, a difference of 0.040%), and Czech (96.4%, a difference of 0.040%).
DemographicsRating | Rank9th Grade
Danes
100.0
/100
|
#13
Exceptional
96.5%
Scottish
100.0
/100
|
#14
Exceptional
96.5%
Irish
100.0
/100
|
#15
Exceptional
96.5%
Croatians
100.0
/100
|
#16
Exceptional
96.5%
Dutch
100.0
/100
|
#17
Exceptional
96.5%
Scandinavians
100.0
/100
|
#18
Exceptional
96.5%
Welsh
100.0
/100
|
#19
Exceptional
96.4%
Italians
100.0
/100
|
#20
Exceptional
96.4%
Alaskan Athabascans
100.0
/100
|
#21
Exceptional
96.4%
Europeans
100.0
/100
|
#22
Exceptional
96.4%
Czechs
100.0
/100
|
#23
Exceptional
96.4%
Latvians
100.0
/100
|
#24
Exceptional
96.4%
French
100.0
/100
|
#25
Exceptional
96.3%
French Canadians
100.0
/100
|
#26
Exceptional
96.3%
Scotch-Irish
100.0
/100
|
#27
Exceptional
96.3%

Demographics Similar to Immigrants from Germany by 9th Grade

In terms of 9th grade, the demographic groups most similar to Immigrants from Germany are Immigrants from Latvia (95.6%, a difference of 0.0%), Creek (95.6%, a difference of 0.010%), Immigrants from Saudi Arabia (95.6%, a difference of 0.010%), Yugoslavian (95.7%, a difference of 0.020%), and South African (95.6%, a difference of 0.020%).
DemographicsRating | Rank9th Grade
Immigrants | Western Europe
99.1
/100
|
#86
Exceptional
95.7%
Okinawans
99.0
/100
|
#87
Exceptional
95.7%
Immigrants | Czechoslovakia
98.9
/100
|
#88
Exceptional
95.7%
Yugoslavians
98.9
/100
|
#89
Exceptional
95.7%
South Africans
98.8
/100
|
#90
Exceptional
95.6%
Creek
98.8
/100
|
#91
Exceptional
95.6%
Immigrants | Saudi Arabia
98.8
/100
|
#92
Exceptional
95.6%
Immigrants | Germany
98.7
/100
|
#93
Exceptional
95.6%
Immigrants | Latvia
98.7
/100
|
#94
Exceptional
95.6%
Americans
98.5
/100
|
#95
Exceptional
95.6%
Filipinos
98.5
/100
|
#96
Exceptional
95.6%
Delaware
98.4
/100
|
#97
Exceptional
95.6%
Immigrants | Japan
98.4
/100
|
#98
Exceptional
95.6%
Menominee
98.3
/100
|
#99
Exceptional
95.6%
Lebanese
98.1
/100
|
#100
Exceptional
95.6%