Italian vs Immigrants from France Master's Degree
COMPARE
Italian
Immigrants from France
Master's Degree
Master's Degree Comparison
Italians
Immigrants from France
16.4%
MASTER'S DEGREE
95.4/ 100
METRIC RATING
125th/ 347
METRIC RANK
20.3%
MASTER'S DEGREE
100.0/ 100
METRIC RATING
23rd/ 347
METRIC RANK
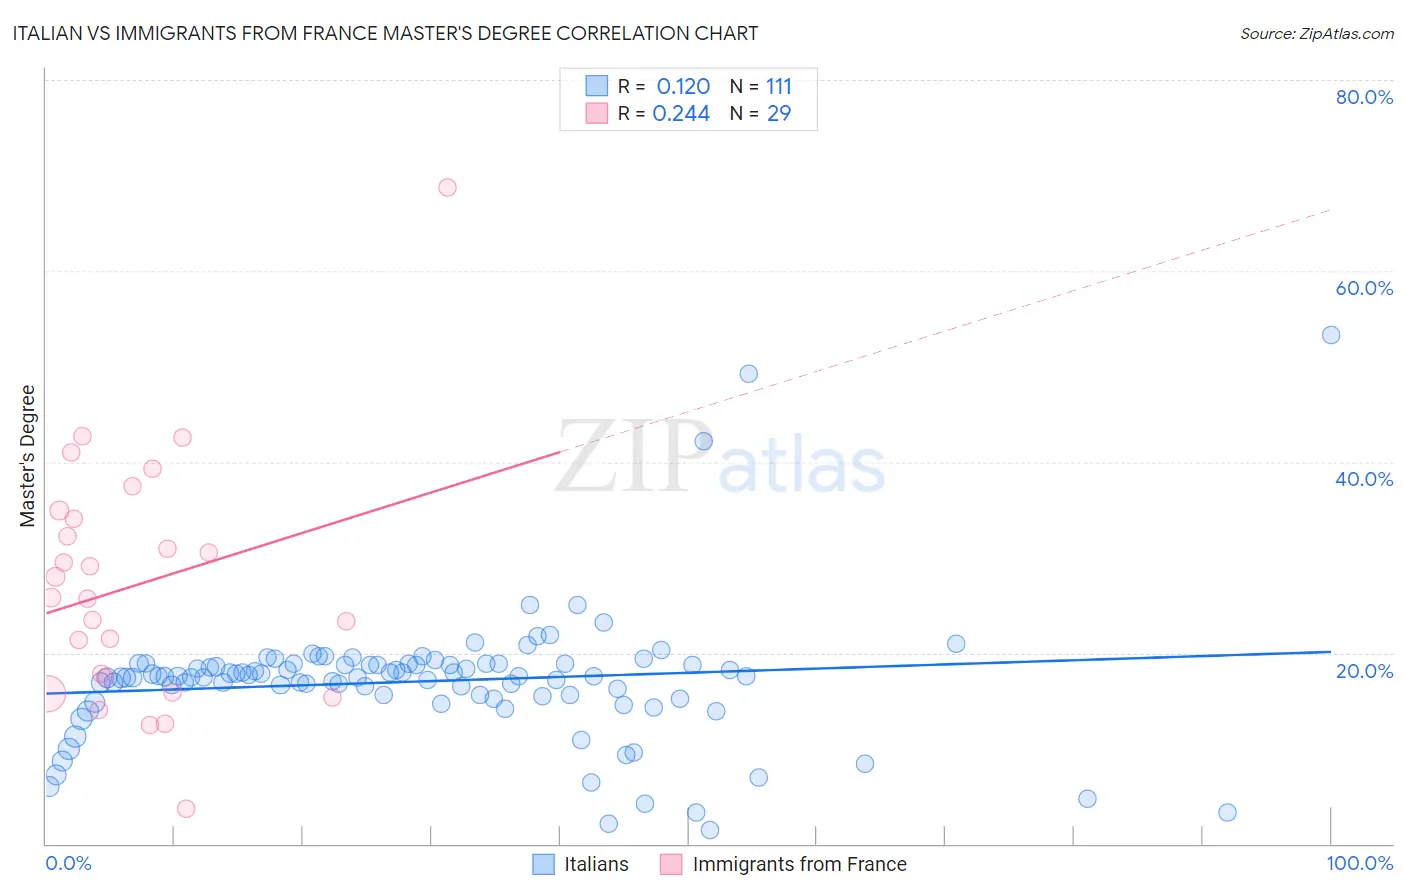
Italian vs Immigrants from France Master's Degree Correlation Chart
The statistical analysis conducted on geographies consisting of 574,113,330 people shows a poor positive correlation between the proportion of Italians and percentage of population with at least master's degree education in the United States with a correlation coefficient (R) of 0.120 and weighted average of 16.4%. Similarly, the statistical analysis conducted on geographies consisting of 287,872,995 people shows a weak positive correlation between the proportion of Immigrants from France and percentage of population with at least master's degree education in the United States with a correlation coefficient (R) of 0.244 and weighted average of 20.3%, a difference of 24.0%.
Master's Degree Correlation Summary
| Measurement | Italian | Immigrants from France |
| Minimum | 1.5% | 3.7% |
| Maximum | 53.3% | 68.8% |
| Range | 51.8% | 65.0% |
| Mean | 17.0% | 27.1% |
| Median | 17.5% | 25.8% |
| Interquartile 25% (IQ1) | 15.4% | 16.6% |
| Interquartile 75% (IQ3) | 18.8% | 34.4% |
| Interquartile Range (IQR) | 3.4% | 17.8% |
| Standard Deviation (Sample) | 7.0% | 12.9% |
| Standard Deviation (Population) | 7.0% | 12.7% |
Similar Demographics by Master's Degree
Demographics Similar to Italians by Master's Degree
In terms of master's degree, the demographic groups most similar to Italians are Immigrants from Eritrea (16.4%, a difference of 0.070%), Immigrants from Eastern Africa (16.3%, a difference of 0.11%), Croatian (16.4%, a difference of 0.14%), British (16.4%, a difference of 0.16%), and Palestinian (16.3%, a difference of 0.37%).
| Demographics | Rating | Rank | Master's Degree |
| Brazilians | 96.8 /100 | #118 | Exceptional 16.5% |
| Jordanians | 96.5 /100 | #119 | Exceptional 16.5% |
| Lebanese | 96.4 /100 | #120 | Exceptional 16.5% |
| Afghans | 96.2 /100 | #121 | Exceptional 16.5% |
| British | 95.6 /100 | #122 | Exceptional 16.4% |
| Croatians | 95.6 /100 | #123 | Exceptional 16.4% |
| Immigrants | Eritrea | 95.5 /100 | #124 | Exceptional 16.4% |
| Italians | 95.4 /100 | #125 | Exceptional 16.4% |
| Immigrants | Eastern Africa | 95.2 /100 | #126 | Exceptional 16.3% |
| Palestinians | 94.8 /100 | #127 | Exceptional 16.3% |
| Immigrants | Sierra Leone | 94.7 /100 | #128 | Exceptional 16.3% |
| Immigrants | Syria | 93.3 /100 | #129 | Exceptional 16.2% |
| Immigrants | Jordan | 92.7 /100 | #130 | Exceptional 16.1% |
| Taiwanese | 91.9 /100 | #131 | Exceptional 16.1% |
| Serbians | 91.7 /100 | #132 | Exceptional 16.1% |
Demographics Similar to Immigrants from France by Master's Degree
In terms of master's degree, the demographic groups most similar to Immigrants from France are Immigrants from Sweden (20.3%, a difference of 0.070%), Israeli (20.3%, a difference of 0.28%), Immigrants from Ireland (20.4%, a difference of 0.70%), Indian (Asian) (20.5%, a difference of 0.81%), and Immigrants from Hong Kong (20.5%, a difference of 0.83%).
| Demographics | Rating | Rank | Master's Degree |
| Immigrants | Belgium | 100.0 /100 | #16 | Exceptional 20.8% |
| Immigrants | South Central Asia | 100.0 /100 | #17 | Exceptional 20.7% |
| Soviet Union | 100.0 /100 | #18 | Exceptional 20.5% |
| Immigrants | Hong Kong | 100.0 /100 | #19 | Exceptional 20.5% |
| Indians (Asian) | 100.0 /100 | #20 | Exceptional 20.5% |
| Immigrants | Ireland | 100.0 /100 | #21 | Exceptional 20.4% |
| Israelis | 100.0 /100 | #22 | Exceptional 20.3% |
| Immigrants | France | 100.0 /100 | #23 | Exceptional 20.3% |
| Immigrants | Sweden | 100.0 /100 | #24 | Exceptional 20.3% |
| Immigrants | Japan | 100.0 /100 | #25 | Exceptional 20.0% |
| Cambodians | 100.0 /100 | #26 | Exceptional 20.0% |
| Immigrants | Sri Lanka | 100.0 /100 | #27 | Exceptional 19.9% |
| Turks | 100.0 /100 | #28 | Exceptional 19.9% |
| Latvians | 100.0 /100 | #29 | Exceptional 19.8% |
| Immigrants | Turkey | 100.0 /100 | #30 | Exceptional 19.7% |