Italian vs Immigrants from Egypt Professional Degree
COMPARE
Italian
Immigrants from Egypt
Professional Degree
Professional Degree Comparison
Italians
Immigrants from Egypt
4.8%
PROFESSIONAL DEGREE
90.2/ 100
METRIC RATING
133rd/ 347
METRIC RANK
5.1%
PROFESSIONAL DEGREE
98.5/ 100
METRIC RATING
101st/ 347
METRIC RANK
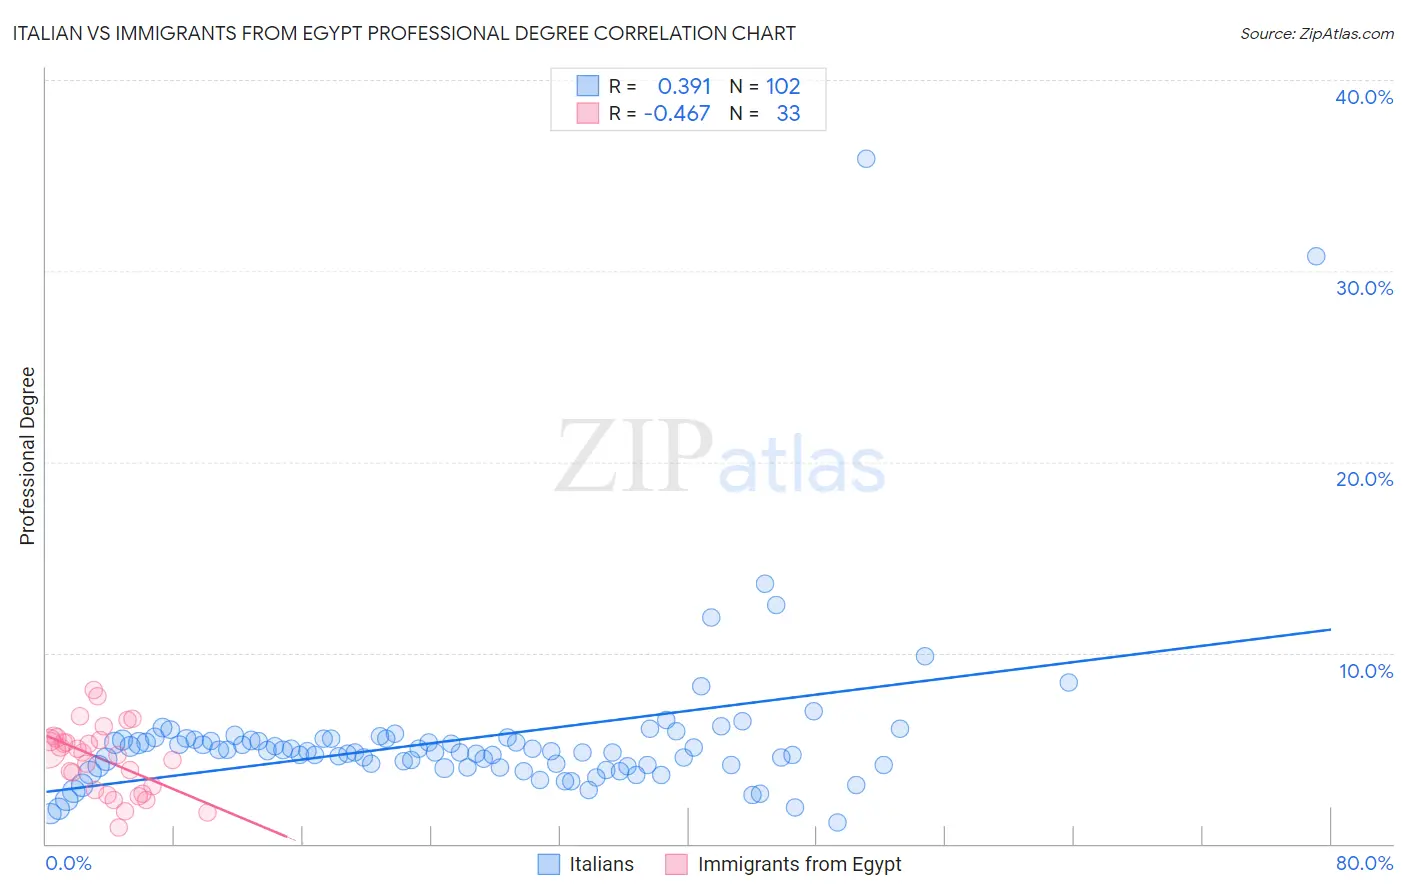
Italian vs Immigrants from Egypt Professional Degree Correlation Chart
The statistical analysis conducted on geographies consisting of 566,305,731 people shows a mild positive correlation between the proportion of Italians and percentage of population with at least professional degree education in the United States with a correlation coefficient (R) of 0.391 and weighted average of 4.8%. Similarly, the statistical analysis conducted on geographies consisting of 245,381,145 people shows a moderate negative correlation between the proportion of Immigrants from Egypt and percentage of population with at least professional degree education in the United States with a correlation coefficient (R) of -0.467 and weighted average of 5.1%, a difference of 6.6%.
Professional Degree Correlation Summary
| Measurement | Italian | Immigrants from Egypt |
| Minimum | 1.1% | 0.86% |
| Maximum | 35.9% | 8.0% |
| Range | 34.7% | 7.2% |
| Mean | 5.5% | 4.4% |
| Median | 4.9% | 4.7% |
| Interquartile 25% (IQ1) | 4.1% | 2.7% |
| Interquartile 75% (IQ3) | 5.5% | 5.5% |
| Interquartile Range (IQR) | 1.4% | 2.7% |
| Standard Deviation (Sample) | 4.4% | 1.8% |
| Standard Deviation (Population) | 4.4% | 1.8% |
Similar Demographics by Professional Degree
Demographics Similar to Italians by Professional Degree
In terms of professional degree, the demographic groups most similar to Italians are South American Indian (4.8%, a difference of 0.12%), Macedonian (4.8%, a difference of 0.16%), Pakistani (4.8%, a difference of 0.25%), Immigrants from Jordan (4.7%, a difference of 0.44%), and Jordanian (4.7%, a difference of 0.46%).
| Demographics | Rating | Rank | Professional Degree |
| Europeans | 93.2 /100 | #126 | Exceptional 4.8% |
| Serbians | 92.6 /100 | #127 | Exceptional 4.8% |
| Immigrants | Eastern Africa | 92.5 /100 | #128 | Exceptional 4.8% |
| Palestinians | 91.5 /100 | #129 | Exceptional 4.8% |
| Icelanders | 91.5 /100 | #130 | Exceptional 4.8% |
| Immigrants | Nepal | 91.4 /100 | #131 | Exceptional 4.8% |
| Pakistanis | 90.9 /100 | #132 | Exceptional 4.8% |
| Italians | 90.2 /100 | #133 | Exceptional 4.8% |
| South American Indians | 89.9 /100 | #134 | Excellent 4.8% |
| Macedonians | 89.8 /100 | #135 | Excellent 4.8% |
| Immigrants | Jordan | 89.0 /100 | #136 | Excellent 4.7% |
| Jordanians | 88.9 /100 | #137 | Excellent 4.7% |
| Afghans | 88.8 /100 | #138 | Excellent 4.7% |
| South Americans | 85.6 /100 | #139 | Excellent 4.7% |
| Canadians | 84.4 /100 | #140 | Excellent 4.7% |
Demographics Similar to Immigrants from Egypt by Professional Degree
In terms of professional degree, the demographic groups most similar to Immigrants from Egypt are Ukrainian (5.1%, a difference of 0.080%), Immigrants from Northern Africa (5.1%, a difference of 0.33%), Arab (5.0%, a difference of 0.64%), Immigrants from Uganda (5.0%, a difference of 0.67%), and Immigrants from Ukraine (5.0%, a difference of 0.69%).
| Demographics | Rating | Rank | Professional Degree |
| Alsatians | 99.3 /100 | #94 | Exceptional 5.2% |
| Zimbabweans | 99.3 /100 | #95 | Exceptional 5.2% |
| Immigrants | Uzbekistan | 99.2 /100 | #96 | Exceptional 5.2% |
| Syrians | 99.1 /100 | #97 | Exceptional 5.2% |
| Austrians | 99.1 /100 | #98 | Exceptional 5.2% |
| Immigrants | Italy | 99.1 /100 | #99 | Exceptional 5.2% |
| Ugandans | 98.8 /100 | #100 | Exceptional 5.1% |
| Immigrants | Egypt | 98.5 /100 | #101 | Exceptional 5.1% |
| Ukrainians | 98.5 /100 | #102 | Exceptional 5.1% |
| Immigrants | Northern Africa | 98.4 /100 | #103 | Exceptional 5.1% |
| Arabs | 98.2 /100 | #104 | Exceptional 5.0% |
| Immigrants | Uganda | 98.2 /100 | #105 | Exceptional 5.0% |
| Immigrants | Ukraine | 98.2 /100 | #106 | Exceptional 5.0% |
| Maltese | 98.1 /100 | #107 | Exceptional 5.0% |
| Immigrants | Southern Europe | 98.1 /100 | #108 | Exceptional 5.0% |