Israeli vs Scotch-Irish Professional Degree
COMPARE
Israeli
Scotch-Irish
Professional Degree
Professional Degree Comparison
Israelis
Scotch-Irish
6.9%
PROFESSIONAL DEGREE
100.0/ 100
METRIC RATING
12th/ 347
METRIC RANK
4.3%
PROFESSIONAL DEGREE
34.2/ 100
METRIC RATING
186th/ 347
METRIC RANK
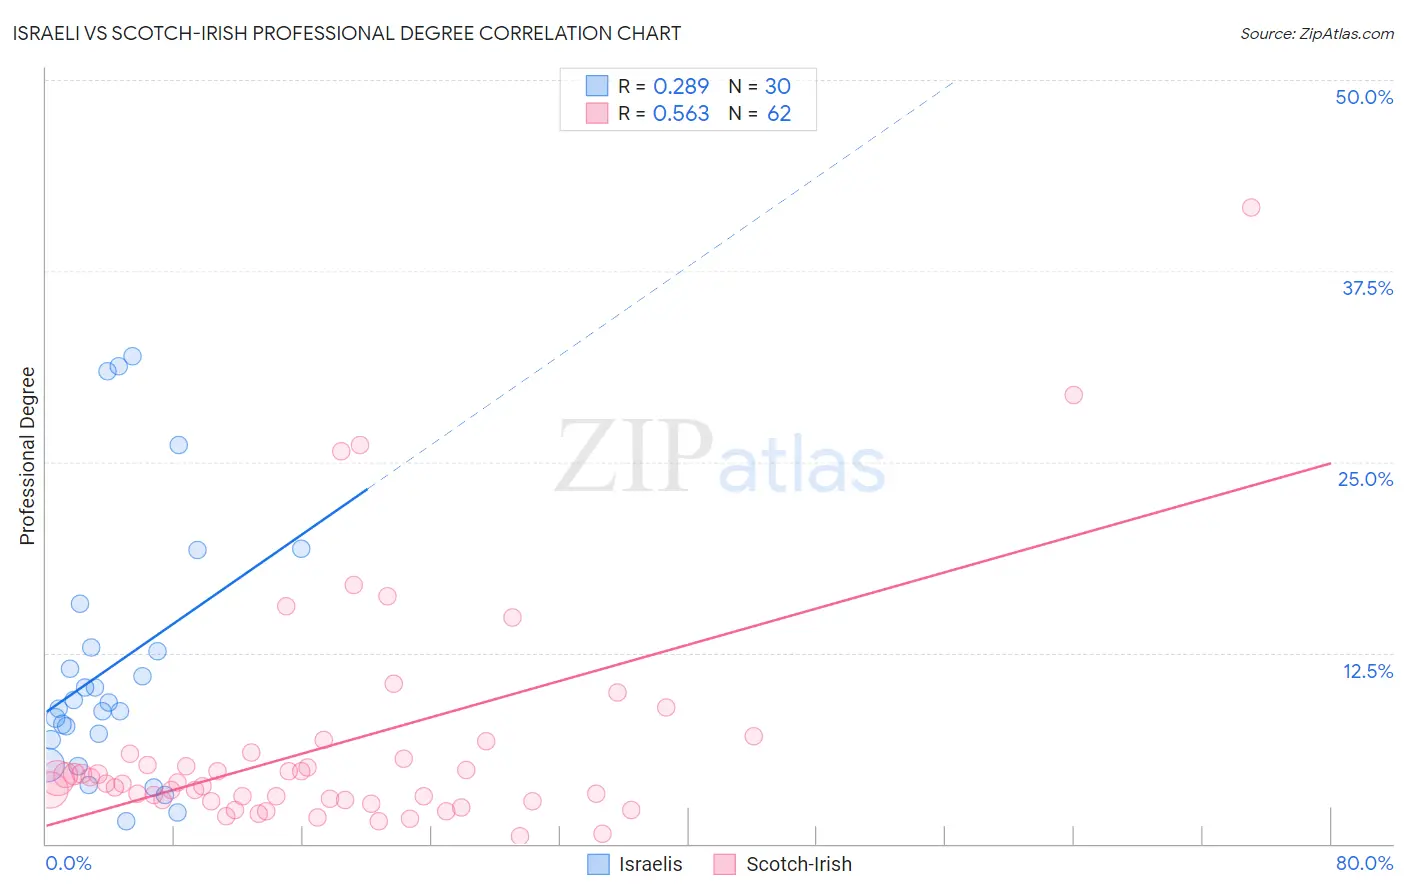
Israeli vs Scotch-Irish Professional Degree Correlation Chart
The statistical analysis conducted on geographies consisting of 210,967,538 people shows a weak positive correlation between the proportion of Israelis and percentage of population with at least professional degree education in the United States with a correlation coefficient (R) of 0.289 and weighted average of 6.9%. Similarly, the statistical analysis conducted on geographies consisting of 542,187,635 people shows a substantial positive correlation between the proportion of Scotch-Irish and percentage of population with at least professional degree education in the United States with a correlation coefficient (R) of 0.563 and weighted average of 4.3%, a difference of 61.2%.
Professional Degree Correlation Summary
| Measurement | Israeli | Scotch-Irish |
| Minimum | 1.5% | 0.53% |
| Maximum | 31.9% | 41.7% |
| Range | 30.5% | 41.1% |
| Mean | 11.7% | 6.5% |
| Median | 9.0% | 4.0% |
| Interquartile 25% (IQ1) | 6.8% | 2.8% |
| Interquartile 75% (IQ3) | 12.9% | 5.9% |
| Interquartile Range (IQR) | 6.0% | 3.0% |
| Standard Deviation (Sample) | 8.5% | 7.5% |
| Standard Deviation (Population) | 8.4% | 7.4% |
Similar Demographics by Professional Degree
Demographics Similar to Israelis by Professional Degree
In terms of professional degree, the demographic groups most similar to Israelis are Cypriot (6.9%, a difference of 0.070%), Immigrants from Belgium (7.0%, a difference of 0.24%), Immigrants from Australia (6.9%, a difference of 0.43%), Immigrants from France (6.8%, a difference of 1.9%), and Immigrants from Taiwan (7.1%, a difference of 2.0%).
| Demographics | Rating | Rank | Professional Degree |
| Immigrants | Iran | 100.0 /100 | #5 | Exceptional 7.3% |
| Okinawans | 100.0 /100 | #6 | Exceptional 7.3% |
| Eastern Europeans | 100.0 /100 | #7 | Exceptional 7.1% |
| Immigrants | Switzerland | 100.0 /100 | #8 | Exceptional 7.1% |
| Immigrants | Taiwan | 100.0 /100 | #9 | Exceptional 7.1% |
| Immigrants | Belgium | 100.0 /100 | #10 | Exceptional 7.0% |
| Cypriots | 100.0 /100 | #11 | Exceptional 6.9% |
| Israelis | 100.0 /100 | #12 | Exceptional 6.9% |
| Immigrants | Australia | 100.0 /100 | #13 | Exceptional 6.9% |
| Immigrants | France | 100.0 /100 | #14 | Exceptional 6.8% |
| Immigrants | China | 100.0 /100 | #15 | Exceptional 6.7% |
| Immigrants | Sweden | 100.0 /100 | #16 | Exceptional 6.7% |
| Immigrants | Eastern Asia | 100.0 /100 | #17 | Exceptional 6.6% |
| Soviet Union | 100.0 /100 | #18 | Exceptional 6.6% |
| Indians (Asian) | 100.0 /100 | #19 | Exceptional 6.5% |
Demographics Similar to Scotch-Irish by Professional Degree
In terms of professional degree, the demographic groups most similar to Scotch-Irish are Immigrants from Cameroon (4.3%, a difference of 0.15%), Welsh (4.3%, a difference of 0.27%), Belgian (4.3%, a difference of 0.32%), Immigrants from Thailand (4.3%, a difference of 0.43%), and Slovak (4.3%, a difference of 0.60%).
| Demographics | Rating | Rank | Professional Degree |
| Immigrants | Kenya | 45.9 /100 | #179 | Average 4.4% |
| Czechs | 44.9 /100 | #180 | Average 4.4% |
| Danes | 43.5 /100 | #181 | Average 4.4% |
| Immigrants | Immigrants | 43.2 /100 | #182 | Average 4.4% |
| Bermudans | 43.1 /100 | #183 | Average 4.4% |
| Belgians | 36.2 /100 | #184 | Fair 4.3% |
| Welsh | 35.8 /100 | #185 | Fair 4.3% |
| Scotch-Irish | 34.2 /100 | #186 | Fair 4.3% |
| Immigrants | Cameroon | 33.3 /100 | #187 | Fair 4.3% |
| Immigrants | Thailand | 31.7 /100 | #188 | Fair 4.3% |
| Slovaks | 30.7 /100 | #189 | Fair 4.3% |
| Immigrants | Poland | 29.2 /100 | #190 | Fair 4.3% |
| Sri Lankans | 29.0 /100 | #191 | Fair 4.3% |
| Ghanaians | 27.3 /100 | #192 | Fair 4.3% |
| French | 27.1 /100 | #193 | Fair 4.2% |