Israeli vs Immigrants from Philippines College, 1 year or more

COMPARE

Israeli
Race
Ancestry
AfghanAfricanAlaska NativeAlaskan AthabascanAlbanianAleutAlsatianAmericanApacheArabArapahoArgentineanArmenianAssyrian/Chaldean/SyriacAustralianAustrianBahamianBangladeshiBarbadianBasqueBelgianBelizeanBermudanBhutaneseBlackfeetBolivianBrazilianBritishBritish West IndianBulgarianBurmeseCajunCambodianCanadianCape VerdeanCarpatho RusynCelticCentral AmericanCentral American IndianCherokeeCheyenneChickasawChileanChineseChippewaChoctawColombianColvilleComancheCosta RicanCreeCreekCroatianCrowCubanCypriotCzechCzechoslovakianDanishDelawareDominicanDutchDutch West IndianEastern EuropeanEcuadorianEgyptianEnglishEstonianEthiopianEuropeanFijianFilipinoFinnishFrenchFrench American IndianFrench CanadianGermanGerman RussianGhanaianGreekGuamanian/ChamorroGuatemalanGuyaneseHaitianHmongHonduranHopiHoumaHungarianIcelanderIndian (Asian)IndonesianInupiatIranianIraqiIrishIroquoisIsraeliItalianJamaicanJapaneseJordanianKenyanKiowaKoreanLaotianLatvianLebaneseLiberianLithuanianLumbeeLuxembourgerMacedonianMalaysianMalteseMarshalleseMenomineeMexicanMexican American IndianMongolianMoroccanNative HawaiianNavajoNepaleseNew ZealanderNicaraguanNigerianNorthern EuropeanNorwegianOkinawanOsageOttawaPaiutePakistaniPalestinianPanamanianParaguayanPennsylvania GermanPeruvianPimaPolishPortuguesePotawatomiPuebloPuerto RicanPuget Sound SalishRomanianRussianSalvadoranSamoanScandinavianScotch-IrishScottishSeminoleSenegaleseSerbianShoshoneSierra LeoneanSiouxSlavicSlovakSloveneSomaliSouth AfricanSouth AmericanSouth American IndianSoviet UnionSpaniardSpanishSpanish AmericanSpanish American IndianSri LankanSubsaharan AfricanSudaneseSwedishSwissSyrianTaiwaneseThaiTlingit-HaidaTohono O'OdhamTonganTrinidadian and TobagonianTsimshianTurkishU.S. Virgin IslanderUgandanUkrainianUruguayanUteVenezuelanVietnameseWelshWest IndianYakamaYaquiYugoslavianYumanYup'ikZimbabwean
Immigration
NonimmigrantsImmigrantsAfghanistanAfricaAlbaniaArgentinaArmeniaAsiaAustraliaAustriaBahamasBangladeshBarbadosBelarusBelgiumBelizeBoliviaBosnia and HerzegovinaBrazilBulgariaBurma/MyanmarCabo VerdeCambodiaCameroonCanadaCaribbeanCentral AmericaChileChinaColombiaCongoCosta RicaCroatiaCubaCzechoslovakiaDenmarkDominicaDominican RepublicEastern AfricaEastern AsiaEastern EuropeEcuadorEgyptEl SalvadorEnglandEritreaEthiopiaEuropeFijiFranceGermanyGhanaGreeceGrenadaGuatemalaGuyanaHaitiHondurasHong KongHungaryIndiaIndonesiaIranIraqIrelandIsraelItalyJamaicaJapanJordanKazakhstanKenyaKoreaKuwaitLaosLatin AmericaLatviaLebanonLiberiaLithuaniaMalaysiaMexicoMicronesiaMiddle AfricaMoldovaMoroccoNepalNetherlandsNicaraguaNigeriaNorth AmericaNorth MacedoniaNorthern AfricaNorthern EuropeNorwayOceaniaPakistanPanamaPeruPolandPortugalRomaniaRussiaSaudi ArabiaScotlandSenegalSerbiaSierra LeoneSingaporeSomaliaSouth AfricaSouth AmericaSouth Central AsiaSouth Eastern AsiaSouthern EuropeSpainSri LankaSt. Vincent and the GrenadinesSudanSwedenSwitzerlandSyriaTaiwanThailandTrinidad and TobagoTurkeyUgandaUkraineUruguayUzbekistanVenezuelaVietnamWest IndiesWestern AfricaWestern AsiaWestern EuropeYemenZaireZimbabweAzores
Immigrants from Philippines
Race
Ancestry
AfghanAfricanAlaska NativeAlaskan AthabascanAlbanianAleutAlsatianAmericanApacheArabArapahoArgentineanArmenianAssyrian/Chaldean/SyriacAustralianAustrianBahamianBangladeshiBarbadianBasqueBelgianBelizeanBermudanBhutaneseBlackfeetBolivianBrazilianBritishBritish West IndianBulgarianBurmeseCajunCambodianCanadianCape VerdeanCarpatho RusynCelticCentral AmericanCentral American IndianCherokeeCheyenneChickasawChileanChineseChippewaChoctawColombianColvilleComancheCosta RicanCreeCreekCroatianCrowCubanCypriotCzechCzechoslovakianDanishDelawareDominicanDutchDutch West IndianEastern EuropeanEcuadorianEgyptianEnglishEstonianEthiopianEuropeanFijianFilipinoFinnishFrenchFrench American IndianFrench CanadianGermanGerman RussianGhanaianGreekGuamanian/ChamorroGuatemalanGuyaneseHaitianHmongHonduranHopiHoumaHungarianIcelanderIndian (Asian)IndonesianInupiatIranianIraqiIrishIroquoisItalianJamaicanJapaneseJordanianKenyanKiowaKoreanLaotianLatvianLebaneseLiberianLithuanianLumbeeLuxembourgerMacedonianMalaysianMalteseMarshalleseMenomineeMexicanMexican American IndianMongolianMoroccanNative HawaiianNavajoNepaleseNew ZealanderNicaraguanNigerianNorthern EuropeanNorwegianOkinawanOsageOttawaPaiutePakistaniPalestinianPanamanianParaguayanPennsylvania GermanPeruvianPimaPolishPortuguesePotawatomiPuebloPuerto RicanPuget Sound SalishRomanianRussianSalvadoranSamoanScandinavianScotch-IrishScottishSeminoleSenegaleseSerbianShoshoneSierra LeoneanSiouxSlavicSlovakSloveneSomaliSouth AfricanSouth AmericanSouth American IndianSoviet UnionSpaniardSpanishSpanish AmericanSpanish American IndianSri LankanSubsaharan AfricanSudaneseSwedishSwissSyrianTaiwaneseThaiTlingit-HaidaTohono O'OdhamTonganTrinidadian and TobagonianTsimshianTurkishU.S. Virgin IslanderUgandanUkrainianUruguayanUteVenezuelanVietnameseWelshWest IndianYakamaYaquiYugoslavianYumanYup'ikZimbabwean
Immigration
NonimmigrantsImmigrantsAfghanistanAfricaAlbaniaArgentinaArmeniaAsiaAustraliaAustriaBahamasBangladeshBarbadosBelarusBelgiumBelizeBoliviaBosnia and HerzegovinaBrazilBulgariaBurma/MyanmarCabo VerdeCambodiaCameroonCanadaCaribbeanCentral AmericaChileChinaColombiaCongoCosta RicaCroatiaCubaCzechoslovakiaDenmarkDominicaDominican RepublicEastern AfricaEastern AsiaEastern EuropeEcuadorEgyptEl SalvadorEnglandEritreaEthiopiaEuropeFijiFranceGermanyGhanaGreeceGrenadaGuatemalaGuyanaHaitiHondurasHong KongHungaryIndiaIndonesiaIranIraqIrelandIsraelItalyJamaicaJapanJordanKazakhstanKenyaKoreaKuwaitLaosLatin AmericaLatviaLebanonLiberiaLithuaniaMalaysiaMexicoMicronesiaMiddle AfricaMoldovaMoroccoNepalNetherlandsNicaraguaNigeriaNorth AmericaNorth MacedoniaNorthern AfricaNorthern EuropeNorwayOceaniaPakistanPanamaPeruPhilippinesPolandPortugalRomaniaRussiaSaudi ArabiaScotlandSenegalSerbiaSierra LeoneSingaporeSomaliaSouth AfricaSouth AmericaSouth Central AsiaSouth Eastern AsiaSouthern EuropeSpainSri LankaSt. Vincent and the GrenadinesSudanSwedenSwitzerlandSyriaTaiwanThailandTrinidad and TobagoTurkeyUgandaUkraineUruguayUzbekistanVenezuelaVietnamWest IndiesWestern AfricaWestern AsiaWestern EuropeYemenZaireZimbabweAzores
College, 1 year or more
Income
Poverty
Unemployment
Labor Participation
Family Structure
Vehicle Availability
Education Level
Disability

College, 1 year or more Comparison

Israelis

Immigrants from Philippines

Exceptional
Fair
65.3%
COLLEGE, 1 YEAR OR MORE
99.9/ 100
METRIC RATING
34th/ 347
METRIC RANK
58.7%
COLLEGE, 1 YEAR OR MORE
29.2/ 100
METRIC RATING
191st/ 347
METRIC RANK

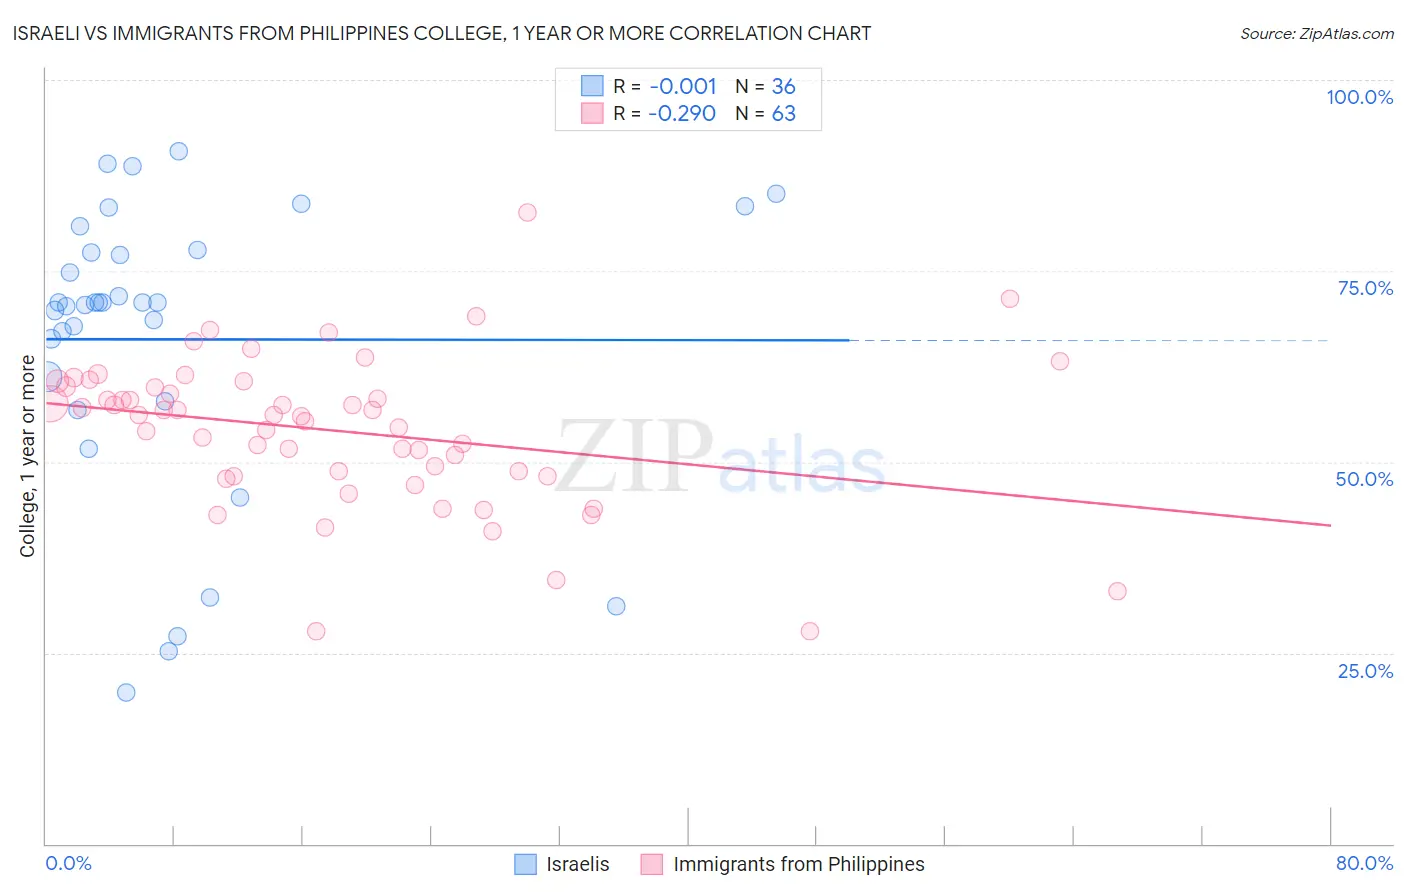
Israeli vs Immigrants from Philippines College, 1 year or more Correlation Chart

The statistical analysis conducted on geographies consisting of 211,218,479 people shows no correlation between the proportion of Israelis and percentage of population with at least college, 1 year or more education in the United States with a correlation coefficient (R) of -0.001 and weighted average of 65.3%. Similarly, the statistical analysis conducted on geographies consisting of 471,303,821 people shows a weak negative correlation between the proportion of Immigrants from Philippines and percentage of population with at least college, 1 year or more education in the United States with a correlation coefficient (R) of -0.290 and weighted average of 58.7%, a difference of 11.3%.
Israeli vs Immigrants from Philippines College, 1 year or more

College, 1 year or more Correlation Summary

MeasurementIsraeliImmigrants from Philippines
Minimum19.8%27.9%
Maximum90.6%82.6%
Range70.9%54.7%
Mean66.0%54.1%
Median70.8%56.1%
Interquartile 25% (IQ1)59.5%48.1%
Interquartile 75% (IQ3)77.6%59.9%
Interquartile Range (IQR)18.0%11.7%
Standard Deviation (Sample)18.8%9.9%
Standard Deviation (Population)18.5%9.8%

Similar Demographics by College, 1 year or more

Demographics Similar to Israelis by College, 1 year or more

In terms of college, 1 year or more, the demographic groups most similar to Israelis are Immigrants from Sri Lanka (65.4%, a difference of 0.12%), Immigrants from Turkey (65.2%, a difference of 0.20%), Bulgarian (65.5%, a difference of 0.27%), Immigrants from South Africa (65.1%, a difference of 0.28%), and Russian (65.1%, a difference of 0.28%).
DemographicsRating | RankCollege, 1 year or more
Immigrants | Ireland
100.0
/100
|
#27
Exceptional
65.9%
Immigrants | France
100.0
/100
|
#28
Exceptional
65.8%
Immigrants | Northern Europe
100.0
/100
|
#29
Exceptional
65.6%
Immigrants | Denmark
100.0
/100
|
#30
Exceptional
65.6%
Turks
100.0
/100
|
#31
Exceptional
65.5%
Bulgarians
100.0
/100
|
#32
Exceptional
65.5%
Immigrants | Sri Lanka
99.9
/100
|
#33
Exceptional
65.4%
Israelis
99.9
/100
|
#34
Exceptional
65.3%
Immigrants | Turkey
99.9
/100
|
#35
Exceptional
65.2%
Immigrants | South Africa
99.9
/100
|
#36
Exceptional
65.1%
Russians
99.9
/100
|
#37
Exceptional
65.1%
Immigrants | Saudi Arabia
99.9
/100
|
#38
Exceptional
65.0%
Estonians
99.9
/100
|
#39
Exceptional
65.0%
Immigrants | Kuwait
99.9
/100
|
#40
Exceptional
65.0%
Mongolians
99.9
/100
|
#41
Exceptional
64.8%

Demographics Similar to Immigrants from Philippines by College, 1 year or more

In terms of college, 1 year or more, the demographic groups most similar to Immigrants from Philippines are Colombian (58.7%, a difference of 0.10%), Peruvian (58.6%, a difference of 0.11%), Immigrants from Cameroon (58.8%, a difference of 0.13%), Uruguayan (58.8%, a difference of 0.17%), and Costa Rican (58.6%, a difference of 0.18%).
DemographicsRating | RankCollege, 1 year or more
Spaniards
38.3
/100
|
#184
Fair
59.0%
South Americans
35.9
/100
|
#185
Fair
59.0%
Scotch-Irish
34.7
/100
|
#186
Fair
58.9%
Germans
34.7
/100
|
#187
Fair
58.9%
French
34.4
/100
|
#188
Fair
58.9%
Uruguayans
31.8
/100
|
#189
Fair
58.8%
Immigrants | Cameroon
31.2
/100
|
#190
Fair
58.8%
Immigrants | Philippines
29.2
/100
|
#191
Fair
58.7%
Colombians
27.6
/100
|
#192
Fair
58.7%
Peruvians
27.5
/100
|
#193
Fair
58.6%
Costa Ricans
26.4
/100
|
#194
Fair
58.6%
Dutch
26.2
/100
|
#195
Fair
58.6%
Guamanians/Chamorros
26.2
/100
|
#196
Fair
58.6%
Immigrants | Thailand
26.0
/100
|
#197
Fair
58.6%
Immigrants | South Eastern Asia
25.1
/100
|
#198
Fair
58.5%