Iroquois vs Immigrants from Western Asia Bachelor's Degree
COMPARE
Iroquois
Immigrants from Western Asia
Bachelor's Degree
Bachelor's Degree Comparison
Iroquois
Immigrants from Western Asia
33.2%
BACHELOR'S DEGREE
0.7/ 100
METRIC RATING
255th/ 347
METRIC RANK
42.3%
BACHELOR'S DEGREE
99.2/ 100
METRIC RATING
84th/ 347
METRIC RANK
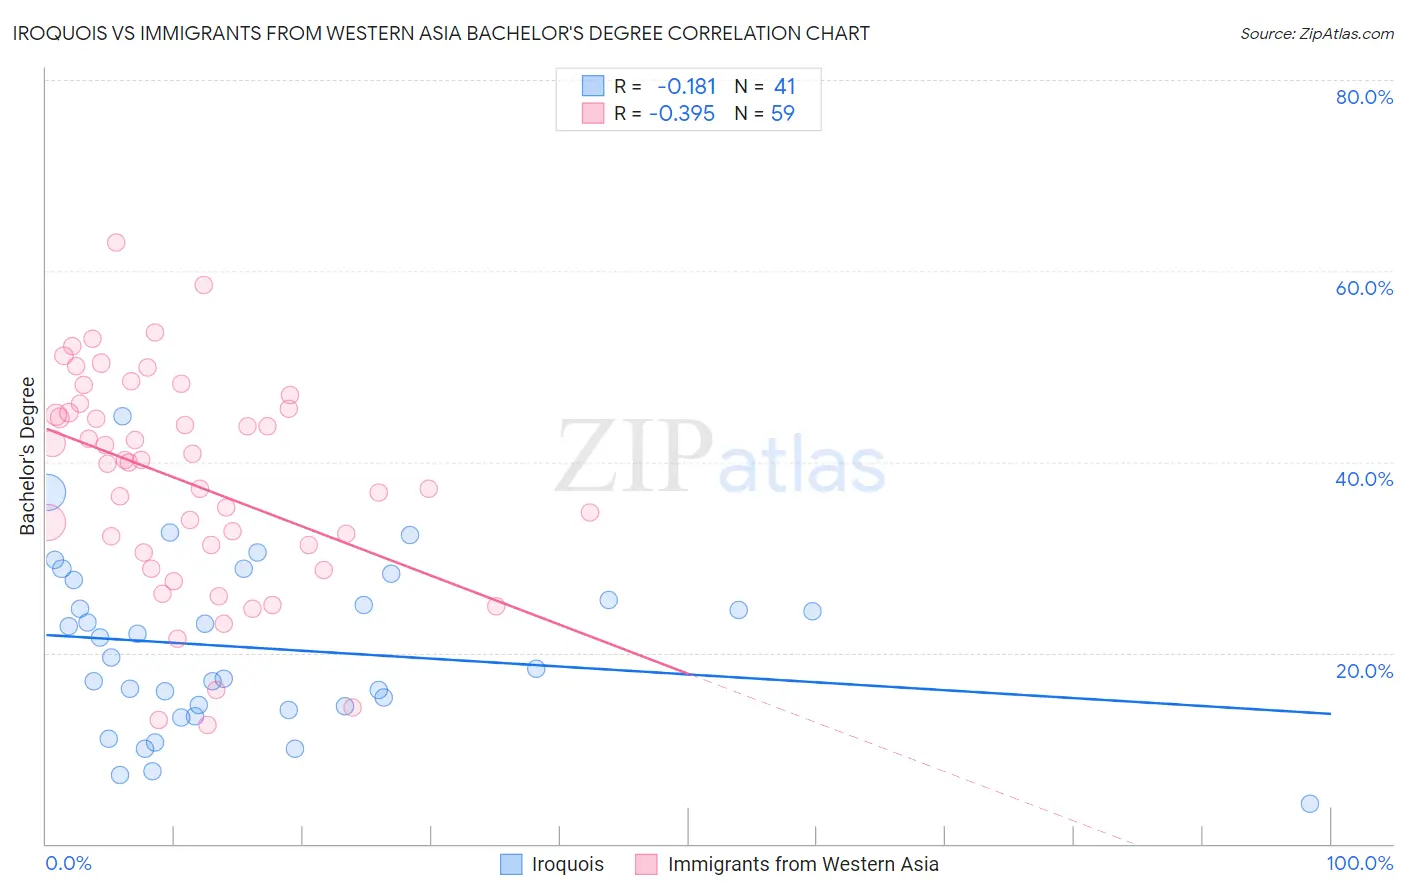
Iroquois vs Immigrants from Western Asia Bachelor's Degree Correlation Chart
The statistical analysis conducted on geographies consisting of 207,306,427 people shows a poor negative correlation between the proportion of Iroquois and percentage of population with at least bachelor's degree education in the United States with a correlation coefficient (R) of -0.181 and weighted average of 33.2%. Similarly, the statistical analysis conducted on geographies consisting of 404,403,411 people shows a mild negative correlation between the proportion of Immigrants from Western Asia and percentage of population with at least bachelor's degree education in the United States with a correlation coefficient (R) of -0.395 and weighted average of 42.3%, a difference of 27.3%.
Bachelor's Degree Correlation Summary
| Measurement | Iroquois | Immigrants from Western Asia |
| Minimum | 4.2% | 12.5% |
| Maximum | 44.8% | 62.9% |
| Range | 40.6% | 50.4% |
| Mean | 20.5% | 37.8% |
| Median | 19.5% | 39.9% |
| Interquartile 25% (IQ1) | 14.2% | 30.5% |
| Interquartile 75% (IQ3) | 26.5% | 45.5% |
| Interquartile Range (IQR) | 12.3% | 15.0% |
| Standard Deviation (Sample) | 8.7% | 11.3% |
| Standard Deviation (Population) | 8.6% | 11.2% |
Similar Demographics by Bachelor's Degree
Demographics Similar to Iroquois by Bachelor's Degree
In terms of bachelor's degree, the demographic groups most similar to Iroquois are Native Hawaiian (33.2%, a difference of 0.020%), U.S. Virgin Islander (33.2%, a difference of 0.080%), Nicaraguan (33.1%, a difference of 0.19%), Immigrants from Bahamas (33.3%, a difference of 0.28%), and Japanese (33.3%, a difference of 0.36%).
| Demographics | Rating | Rank | Bachelor's Degree |
| Cree | 1.0 /100 | #248 | Tragic 33.6% |
| Immigrants | Liberia | 0.9 /100 | #249 | Tragic 33.5% |
| Indonesians | 0.9 /100 | #250 | Tragic 33.5% |
| Japanese | 0.7 /100 | #251 | Tragic 33.3% |
| Immigrants | Bahamas | 0.7 /100 | #252 | Tragic 33.3% |
| U.S. Virgin Islanders | 0.7 /100 | #253 | Tragic 33.2% |
| Native Hawaiians | 0.7 /100 | #254 | Tragic 33.2% |
| Iroquois | 0.7 /100 | #255 | Tragic 33.2% |
| Nicaraguans | 0.6 /100 | #256 | Tragic 33.1% |
| Spanish Americans | 0.6 /100 | #257 | Tragic 33.1% |
| French American Indians | 0.6 /100 | #258 | Tragic 33.1% |
| Osage | 0.5 /100 | #259 | Tragic 33.0% |
| Malaysians | 0.5 /100 | #260 | Tragic 32.9% |
| Africans | 0.5 /100 | #261 | Tragic 32.9% |
| Immigrants | Jamaica | 0.5 /100 | #262 | Tragic 32.9% |
Demographics Similar to Immigrants from Western Asia by Bachelor's Degree
In terms of bachelor's degree, the demographic groups most similar to Immigrants from Western Asia are Armenian (42.3%, a difference of 0.020%), Lithuanian (42.2%, a difference of 0.030%), Immigrants from Scotland (42.3%, a difference of 0.050%), Immigrants from Hungary (42.3%, a difference of 0.11%), and Immigrants from Brazil (42.2%, a difference of 0.11%).
| Demographics | Rating | Rank | Bachelor's Degree |
| Immigrants | Eastern Europe | 99.4 /100 | #77 | Exceptional 42.5% |
| Immigrants | Ethiopia | 99.4 /100 | #78 | Exceptional 42.5% |
| Immigrants | Lebanon | 99.3 /100 | #79 | Exceptional 42.4% |
| Immigrants | Croatia | 99.2 /100 | #80 | Exceptional 42.3% |
| Immigrants | Hungary | 99.2 /100 | #81 | Exceptional 42.3% |
| Immigrants | Scotland | 99.2 /100 | #82 | Exceptional 42.3% |
| Armenians | 99.2 /100 | #83 | Exceptional 42.3% |
| Immigrants | Western Asia | 99.2 /100 | #84 | Exceptional 42.3% |
| Lithuanians | 99.2 /100 | #85 | Exceptional 42.2% |
| Immigrants | Brazil | 99.2 /100 | #86 | Exceptional 42.2% |
| Carpatho Rusyns | 99.0 /100 | #87 | Exceptional 42.1% |
| Immigrants | Western Europe | 99.0 /100 | #88 | Exceptional 42.0% |
| Greeks | 99.0 /100 | #89 | Exceptional 42.0% |
| Laotians | 98.9 /100 | #90 | Exceptional 42.0% |
| Immigrants | Northern Africa | 98.9 /100 | #91 | Exceptional 41.9% |