Iroquois vs Immigrants from Latin America Associate's Degree
COMPARE
Iroquois
Immigrants from Latin America
Associate's Degree
Associate's Degree Comparison
Iroquois
Immigrants from Latin America
42.8%
ASSOCIATE'S DEGREE
1.7/ 100
METRIC RATING
238th/ 347
METRIC RANK
37.9%
ASSOCIATE'S DEGREE
0.0/ 100
METRIC RATING
311th/ 347
METRIC RANK
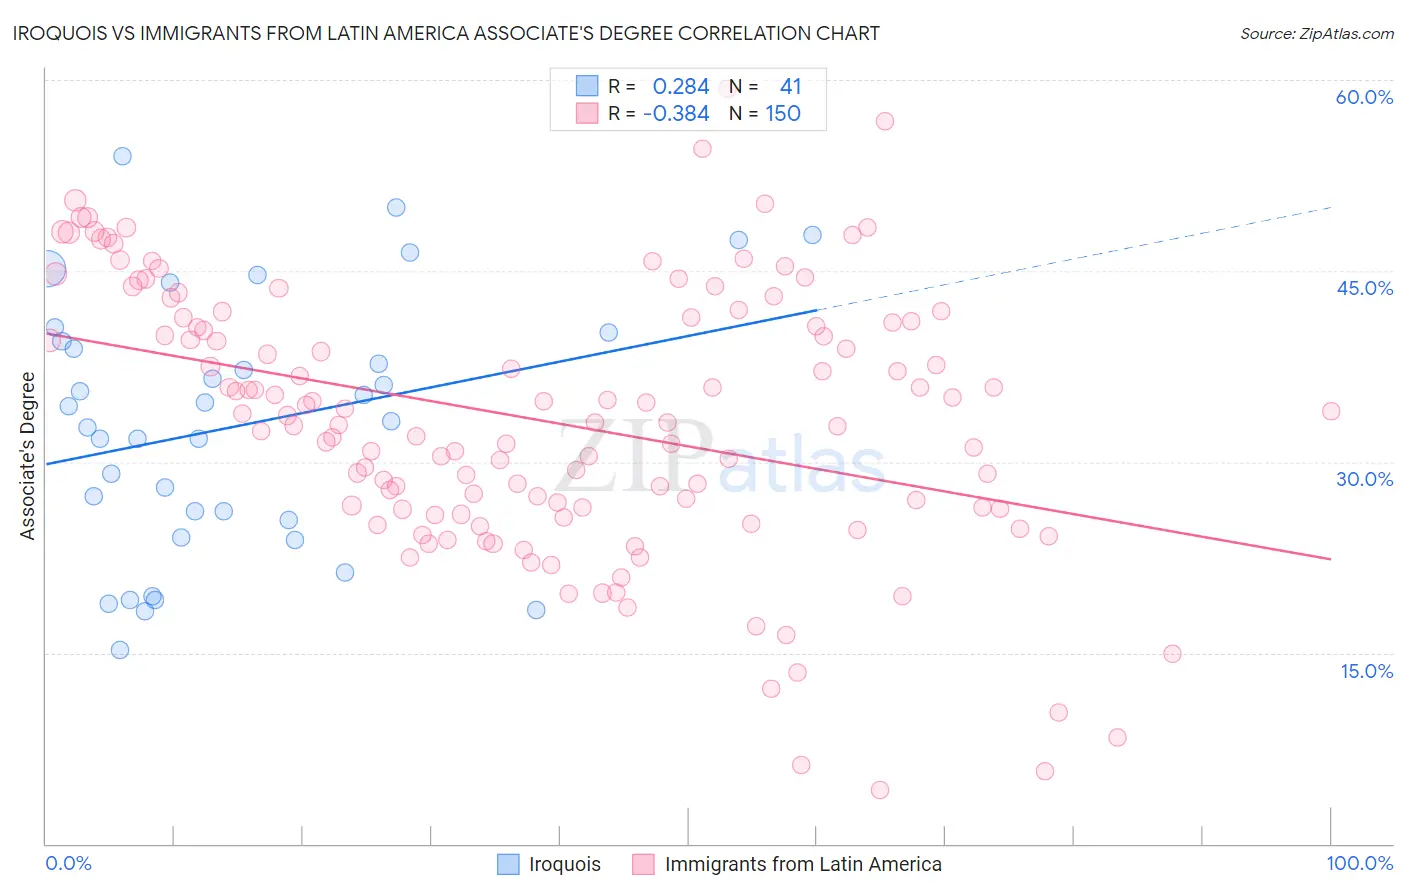
Iroquois vs Immigrants from Latin America Associate's Degree Correlation Chart
The statistical analysis conducted on geographies consisting of 207,308,228 people shows a weak positive correlation between the proportion of Iroquois and percentage of population with at least associate's degree education in the United States with a correlation coefficient (R) of 0.284 and weighted average of 42.8%. Similarly, the statistical analysis conducted on geographies consisting of 558,543,762 people shows a mild negative correlation between the proportion of Immigrants from Latin America and percentage of population with at least associate's degree education in the United States with a correlation coefficient (R) of -0.384 and weighted average of 37.9%, a difference of 13.1%.
Associate's Degree Correlation Summary
| Measurement | Iroquois | Immigrants from Latin America |
| Minimum | 15.2% | 4.2% |
| Maximum | 54.0% | 59.3% |
| Range | 38.7% | 55.1% |
| Mean | 32.9% | 33.3% |
| Median | 33.2% | 33.4% |
| Interquartile 25% (IQ1) | 24.8% | 26.3% |
| Interquartile 75% (IQ3) | 39.9% | 41.3% |
| Interquartile Range (IQR) | 15.1% | 15.0% |
| Standard Deviation (Sample) | 10.1% | 10.6% |
| Standard Deviation (Population) | 9.9% | 10.6% |
Similar Demographics by Associate's Degree
Demographics Similar to Iroquois by Associate's Degree
In terms of associate's degree, the demographic groups most similar to Iroquois are Nonimmigrants (42.9%, a difference of 0.26%), Immigrants from St. Vincent and the Grenadines (42.9%, a difference of 0.28%), Ecuadorian (43.0%, a difference of 0.36%), Tlingit-Haida (43.0%, a difference of 0.45%), and Immigrants from Grenada (42.6%, a difference of 0.51%).
| Demographics | Rating | Rank | Associate's Degree |
| Liberians | 2.9 /100 | #231 | Tragic 43.3% |
| Native Hawaiians | 2.3 /100 | #232 | Tragic 43.1% |
| Tongans | 2.2 /100 | #233 | Tragic 43.0% |
| Tlingit-Haida | 2.1 /100 | #234 | Tragic 43.0% |
| Ecuadorians | 2.0 /100 | #235 | Tragic 43.0% |
| Immigrants | St. Vincent and the Grenadines | 1.9 /100 | #236 | Tragic 42.9% |
| Immigrants | Nonimmigrants | 1.9 /100 | #237 | Tragic 42.9% |
| Iroquois | 1.7 /100 | #238 | Tragic 42.8% |
| Immigrants | Grenada | 1.3 /100 | #239 | Tragic 42.6% |
| Cree | 1.2 /100 | #240 | Tragic 42.5% |
| British West Indians | 1.0 /100 | #241 | Tragic 42.4% |
| Immigrants | West Indies | 1.0 /100 | #242 | Tragic 42.4% |
| Guyanese | 1.0 /100 | #243 | Tragic 42.3% |
| Immigrants | Liberia | 0.9 /100 | #244 | Tragic 42.3% |
| Immigrants | Cambodia | 0.9 /100 | #245 | Tragic 42.3% |
Demographics Similar to Immigrants from Latin America by Associate's Degree
In terms of associate's degree, the demographic groups most similar to Immigrants from Latin America are Immigrants from Dominican Republic (37.9%, a difference of 0.11%), Choctaw (37.8%, a difference of 0.22%), Hispanic or Latino (37.7%, a difference of 0.37%), Seminole (37.7%, a difference of 0.42%), and Immigrants from Guatemala (38.1%, a difference of 0.73%).
| Demographics | Rating | Rank | Associate's Degree |
| Sioux | 0.0 /100 | #304 | Tragic 38.5% |
| Immigrants | Honduras | 0.0 /100 | #305 | Tragic 38.5% |
| Shoshone | 0.0 /100 | #306 | Tragic 38.4% |
| Immigrants | El Salvador | 0.0 /100 | #307 | Tragic 38.4% |
| Mexican American Indians | 0.0 /100 | #308 | Tragic 38.2% |
| Immigrants | Guatemala | 0.0 /100 | #309 | Tragic 38.1% |
| Immigrants | Dominican Republic | 0.0 /100 | #310 | Tragic 37.9% |
| Immigrants | Latin America | 0.0 /100 | #311 | Tragic 37.9% |
| Choctaw | 0.0 /100 | #312 | Tragic 37.8% |
| Hispanics or Latinos | 0.0 /100 | #313 | Tragic 37.7% |
| Seminole | 0.0 /100 | #314 | Tragic 37.7% |
| Creek | 0.0 /100 | #315 | Tragic 37.6% |
| Crow | 0.0 /100 | #316 | Tragic 37.6% |
| Yaqui | 0.0 /100 | #317 | Tragic 37.6% |
| Alaska Natives | 0.0 /100 | #318 | Tragic 37.5% |