Irish vs Tsimshian 10th Grade
COMPARE
Irish
Tsimshian
10th Grade
10th Grade Comparison
Irish
Tsimshian
95.6%
10TH GRADE
100.0/ 100
METRIC RATING
15th/ 347
METRIC RANK
95.6%
10TH GRADE
100.0/ 100
METRIC RATING
14th/ 347
METRIC RANK
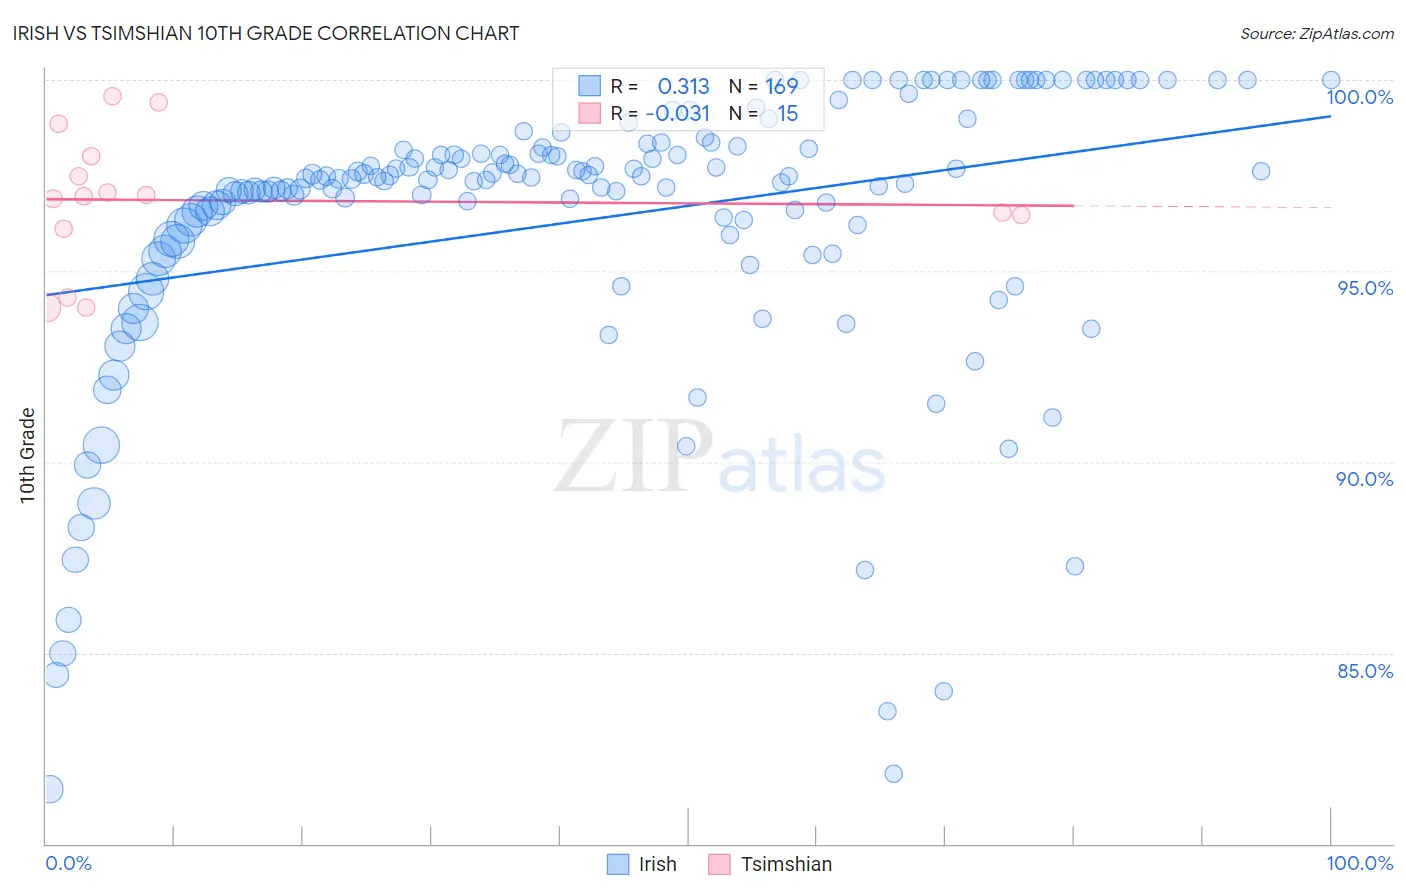
Irish vs Tsimshian 10th Grade Correlation Chart
The statistical analysis conducted on geographies consisting of 580,709,891 people shows a mild positive correlation between the proportion of Irish and percentage of population with at least 10th grade education in the United States with a correlation coefficient (R) of 0.313 and weighted average of 95.6%. Similarly, the statistical analysis conducted on geographies consisting of 15,626,544 people shows no correlation between the proportion of Tsimshian and percentage of population with at least 10th grade education in the United States with a correlation coefficient (R) of -0.031 and weighted average of 95.6%, a difference of 0.020%.
10th Grade Correlation Summary
| Measurement | Irish | Tsimshian |
| Minimum | 81.4% | 94.0% |
| Maximum | 100.0% | 99.6% |
| Range | 18.6% | 5.5% |
| Mean | 96.4% | 96.8% |
| Median | 97.4% | 96.9% |
| Interquartile 25% (IQ1) | 95.9% | 96.1% |
| Interquartile 75% (IQ3) | 98.3% | 98.0% |
| Interquartile Range (IQR) | 2.4% | 1.9% |
| Standard Deviation (Sample) | 3.8% | 1.7% |
| Standard Deviation (Population) | 3.8% | 1.7% |
Demographics Similar to Irish and Tsimshian by 10th Grade
In terms of 10th grade, the demographic groups most similar to Irish are Scottish (95.6%, a difference of 0.010%), Latvian (95.6%, a difference of 0.020%), English (95.6%, a difference of 0.030%), Italian (95.6%, a difference of 0.030%), and Scandinavian (95.6%, a difference of 0.040%). Similarly, the demographic groups most similar to Tsimshian are English (95.6%, a difference of 0.010%), Scottish (95.6%, a difference of 0.030%), Tlingit-Haida (95.7%, a difference of 0.040%), Latvian (95.6%, a difference of 0.040%), and Italian (95.6%, a difference of 0.050%).
| Demographics | Rating | Rank | 10th Grade |
| Swedes | 100.0 /100 | #4 | Exceptional 95.9% |
| Carpatho Rusyns | 100.0 /100 | #5 | Exceptional 95.9% |
| Poles | 100.0 /100 | #6 | Exceptional 95.8% |
| Germans | 100.0 /100 | #7 | Exceptional 95.8% |
| Lithuanians | 100.0 /100 | #8 | Exceptional 95.8% |
| Finns | 100.0 /100 | #9 | Exceptional 95.8% |
| Croatians | 100.0 /100 | #10 | Exceptional 95.7% |
| Danes | 100.0 /100 | #11 | Exceptional 95.7% |
| Tlingit-Haida | 100.0 /100 | #12 | Exceptional 95.7% |
| English | 100.0 /100 | #13 | Exceptional 95.6% |
| Tsimshian | 100.0 /100 | #14 | Exceptional 95.6% |
| Irish | 100.0 /100 | #15 | Exceptional 95.6% |
| Scottish | 100.0 /100 | #16 | Exceptional 95.6% |
| Latvians | 100.0 /100 | #17 | Exceptional 95.6% |
| Italians | 100.0 /100 | #18 | Exceptional 95.6% |
| Scandinavians | 100.0 /100 | #19 | Exceptional 95.6% |
| Chinese | 100.0 /100 | #20 | Exceptional 95.5% |
| Dutch | 100.0 /100 | #21 | Exceptional 95.5% |
| Eastern Europeans | 100.0 /100 | #22 | Exceptional 95.5% |
| Czechs | 100.0 /100 | #23 | Exceptional 95.5% |
| Europeans | 100.0 /100 | #24 | Exceptional 95.5% |