Irish vs Iroquois High School Diploma

COMPARE

Irish
Race
Ancestry
AfghanAfricanAlaska NativeAlaskan AthabascanAlbanianAleutAlsatianAmericanApacheArabArapahoArgentineanArmenianAssyrian/Chaldean/SyriacAustralianAustrianBahamianBangladeshiBarbadianBasqueBelgianBelizeanBermudanBhutaneseBlackfeetBolivianBrazilianBritishBritish West IndianBulgarianBurmeseCajunCambodianCanadianCape VerdeanCarpatho RusynCelticCentral AmericanCentral American IndianCherokeeCheyenneChickasawChileanChineseChippewaChoctawColombianColvilleComancheCosta RicanCreeCreekCroatianCrowCubanCypriotCzechCzechoslovakianDanishDelawareDominicanDutchDutch West IndianEastern EuropeanEcuadorianEgyptianEnglishEstonianEthiopianEuropeanFijianFilipinoFinnishFrenchFrench American IndianFrench CanadianGermanGerman RussianGhanaianGreekGuamanian/ChamorroGuatemalanGuyaneseHaitianHmongHonduranHopiHoumaHungarianIcelanderIndian (Asian)IndonesianInupiatIranianIraqiIrishIsraeliItalianJamaicanJapaneseJordanianKenyanKiowaKoreanLaotianLatvianLebaneseLiberianLithuanianLumbeeLuxembourgerMacedonianMalaysianMalteseMarshalleseMenomineeMexicanMexican American IndianMongolianMoroccanNative HawaiianNavajoNepaleseNew ZealanderNicaraguanNigerianNorthern EuropeanNorwegianOkinawanOsageOttawaPaiutePakistaniPalestinianPanamanianParaguayanPennsylvania GermanPeruvianPimaPolishPortuguesePotawatomiPuebloPuerto RicanPuget Sound SalishRomanianRussianSalvadoranSamoanScandinavianScotch-IrishScottishSeminoleSenegaleseSerbianShoshoneSierra LeoneanSiouxSlavicSlovakSloveneSomaliSouth AfricanSouth AmericanSouth American IndianSoviet UnionSpaniardSpanishSpanish AmericanSpanish American IndianSri LankanSubsaharan AfricanSudaneseSwedishSwissSyrianTaiwaneseThaiTlingit-HaidaTohono O'OdhamTonganTrinidadian and TobagonianTsimshianTurkishU.S. Virgin IslanderUgandanUkrainianUruguayanUteVenezuelanVietnameseWelshWest IndianYakamaYaquiYugoslavianYumanYup'ikZimbabwean
Immigration
NonimmigrantsImmigrantsAfghanistanAfricaAlbaniaArgentinaArmeniaAsiaAustraliaAustriaBahamasBangladeshBarbadosBelarusBelgiumBelizeBoliviaBosnia and HerzegovinaBrazilBulgariaBurma/MyanmarCabo VerdeCambodiaCameroonCanadaCaribbeanCentral AmericaChileChinaColombiaCongoCosta RicaCroatiaCubaCzechoslovakiaDenmarkDominicaDominican RepublicEastern AfricaEastern AsiaEastern EuropeEcuadorEgyptEl SalvadorEnglandEritreaEthiopiaEuropeFijiFranceGermanyGhanaGreeceGrenadaGuatemalaGuyanaHaitiHondurasHong KongHungaryIndiaIndonesiaIranIraqIrelandIsraelItalyJamaicaJapanJordanKazakhstanKenyaKoreaKuwaitLaosLatin AmericaLatviaLebanonLiberiaLithuaniaMalaysiaMexicoMicronesiaMiddle AfricaMoldovaMoroccoNepalNetherlandsNicaraguaNigeriaNorth AmericaNorth MacedoniaNorthern AfricaNorthern EuropeNorwayOceaniaPakistanPanamaPeruPhilippinesPolandPortugalRomaniaRussiaSaudi ArabiaScotlandSenegalSerbiaSierra LeoneSingaporeSomaliaSouth AfricaSouth AmericaSouth Central AsiaSouth Eastern AsiaSouthern EuropeSpainSri LankaSt. Vincent and the GrenadinesSudanSwedenSwitzerlandSyriaTaiwanThailandTrinidad and TobagoTurkeyUgandaUkraineUruguayUzbekistanVenezuelaVietnamWest IndiesWestern AfricaWestern AsiaWestern EuropeYemenZaireZimbabweAzores
Iroquois
Race
Ancestry
AfghanAfricanAlaska NativeAlaskan AthabascanAlbanianAleutAlsatianAmericanApacheArabArapahoArgentineanArmenianAssyrian/Chaldean/SyriacAustralianAustrianBahamianBangladeshiBarbadianBasqueBelgianBelizeanBermudanBhutaneseBlackfeetBolivianBrazilianBritishBritish West IndianBulgarianBurmeseCajunCambodianCanadianCape VerdeanCarpatho RusynCelticCentral AmericanCentral American IndianCherokeeCheyenneChickasawChileanChineseChippewaChoctawColombianColvilleComancheCosta RicanCreeCreekCroatianCrowCubanCypriotCzechCzechoslovakianDanishDelawareDominicanDutchDutch West IndianEastern EuropeanEcuadorianEgyptianEnglishEstonianEthiopianEuropeanFijianFilipinoFinnishFrenchFrench American IndianFrench CanadianGermanGerman RussianGhanaianGreekGuamanian/ChamorroGuatemalanGuyaneseHaitianHmongHonduranHopiHoumaHungarianIcelanderIndian (Asian)IndonesianInupiatIranianIraqiIroquoisIsraeliItalianJamaicanJapaneseJordanianKenyanKiowaKoreanLaotianLatvianLebaneseLiberianLithuanianLumbeeLuxembourgerMacedonianMalaysianMalteseMarshalleseMenomineeMexicanMexican American IndianMongolianMoroccanNative HawaiianNavajoNepaleseNew ZealanderNicaraguanNigerianNorthern EuropeanNorwegianOkinawanOsageOttawaPaiutePakistaniPalestinianPanamanianParaguayanPennsylvania GermanPeruvianPimaPolishPortuguesePotawatomiPuebloPuerto RicanPuget Sound SalishRomanianRussianSalvadoranSamoanScandinavianScotch-IrishScottishSeminoleSenegaleseSerbianShoshoneSierra LeoneanSiouxSlavicSlovakSloveneSomaliSouth AfricanSouth AmericanSouth American IndianSoviet UnionSpaniardSpanishSpanish AmericanSpanish American IndianSri LankanSubsaharan AfricanSudaneseSwedishSwissSyrianTaiwaneseThaiTlingit-HaidaTohono O'OdhamTonganTrinidadian and TobagonianTsimshianTurkishU.S. Virgin IslanderUgandanUkrainianUruguayanUteVenezuelanVietnameseWelshWest IndianYakamaYaquiYugoslavianYumanYup'ikZimbabwean
Immigration
NonimmigrantsImmigrantsAfghanistanAfricaAlbaniaArgentinaArmeniaAsiaAustraliaAustriaBahamasBangladeshBarbadosBelarusBelgiumBelizeBoliviaBosnia and HerzegovinaBrazilBulgariaBurma/MyanmarCabo VerdeCambodiaCameroonCanadaCaribbeanCentral AmericaChileChinaColombiaCongoCosta RicaCroatiaCubaCzechoslovakiaDenmarkDominicaDominican RepublicEastern AfricaEastern AsiaEastern EuropeEcuadorEgyptEl SalvadorEnglandEritreaEthiopiaEuropeFijiFranceGermanyGhanaGreeceGrenadaGuatemalaGuyanaHaitiHondurasHong KongHungaryIndiaIndonesiaIranIraqIrelandIsraelItalyJamaicaJapanJordanKazakhstanKenyaKoreaKuwaitLaosLatin AmericaLatviaLebanonLiberiaLithuaniaMalaysiaMexicoMicronesiaMiddle AfricaMoldovaMoroccoNepalNetherlandsNicaraguaNigeriaNorth AmericaNorth MacedoniaNorthern AfricaNorthern EuropeNorwayOceaniaPakistanPanamaPeruPhilippinesPolandPortugalRomaniaRussiaSaudi ArabiaScotlandSenegalSerbiaSierra LeoneSingaporeSomaliaSouth AfricaSouth AmericaSouth Central AsiaSouth Eastern AsiaSouthern EuropeSpainSri LankaSt. Vincent and the GrenadinesSudanSwedenSwitzerlandSyriaTaiwanThailandTrinidad and TobagoTurkeyUgandaUkraineUruguayUzbekistanVenezuelaVietnamWest IndiesWestern AfricaWestern AsiaWestern EuropeYemenZaireZimbabweAzores
High School Diploma
Income
Poverty
Unemployment
Labor Participation
Family Structure
Vehicle Availability
Education Level
Disability

High School Diploma Comparison

Irish

Iroquois

Exceptional
Average
91.4%
HIGH SCHOOL DIPLOMA
99.9/ 100
METRIC RATING
35th/ 347
METRIC RANK
89.2%
HIGH SCHOOL DIPLOMA
55.1/ 100
METRIC RATING
169th/ 347
METRIC RANK

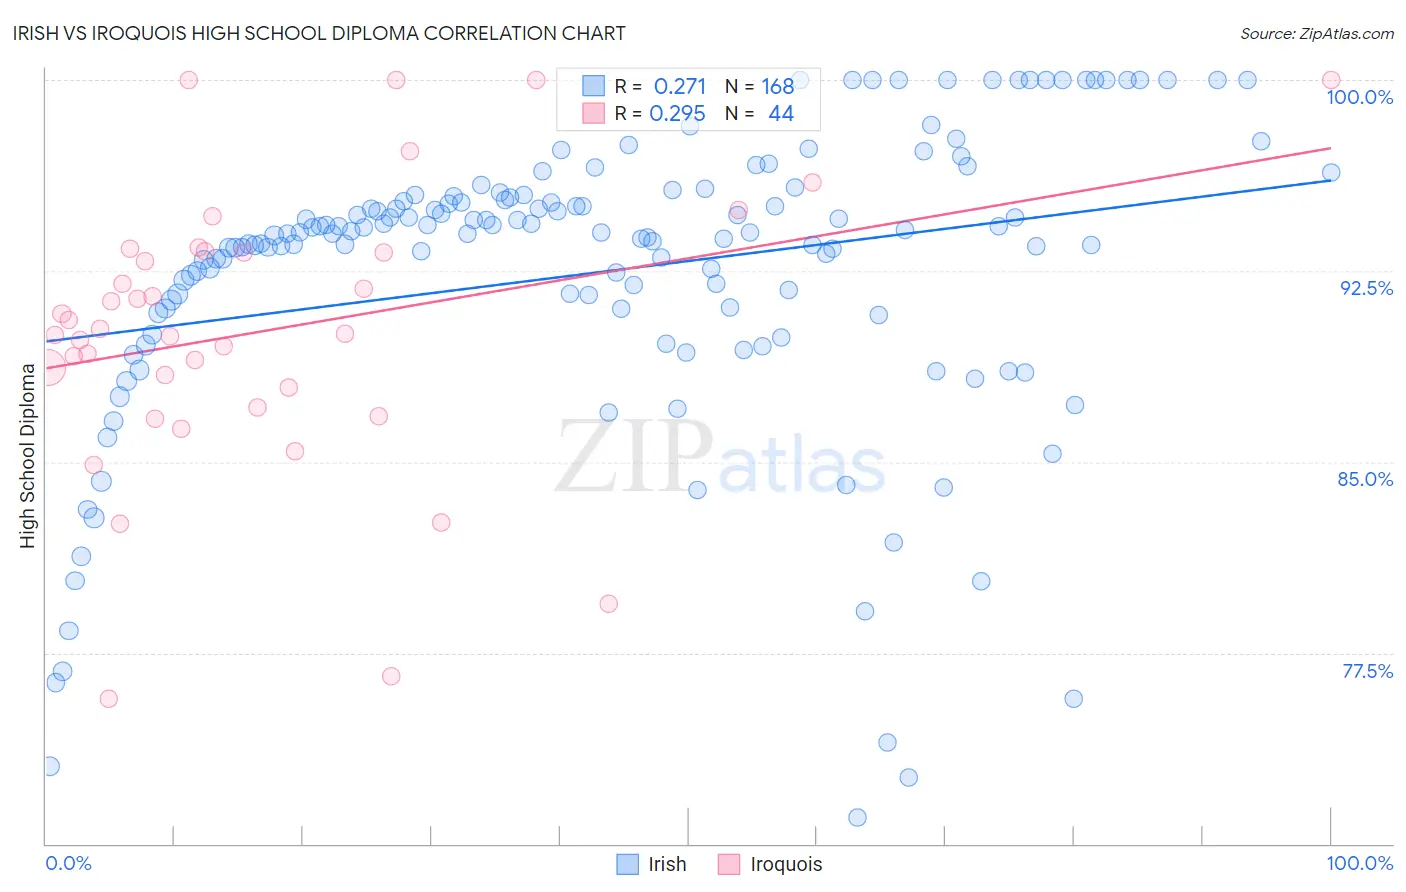
Irish vs Iroquois High School Diploma Correlation Chart

The statistical analysis conducted on geographies consisting of 580,709,825 people shows a weak positive correlation between the proportion of Irish and percentage of population with at least high school diploma education in the United States with a correlation coefficient (R) of 0.271 and weighted average of 91.4%. Similarly, the statistical analysis conducted on geographies consisting of 207,308,653 people shows a weak positive correlation between the proportion of Iroquois and percentage of population with at least high school diploma education in the United States with a correlation coefficient (R) of 0.295 and weighted average of 89.2%, a difference of 2.4%.
Irish vs Iroquois High School Diploma

High School Diploma Correlation Summary

MeasurementIrishIroquois
Minimum71.0%75.7%
Maximum100.0%100.0%
Range29.0%24.3%
Mean92.4%90.2%
Median94.0%90.1%
Interquartile 25% (IQ1)90.9%87.5%
Interquartile 75% (IQ3)95.3%93.3%
Interquartile Range (IQR)4.4%5.7%
Standard Deviation (Sample)5.9%5.5%
Standard Deviation (Population)5.9%5.5%

Similar Demographics by High School Diploma

Demographics Similar to Irish by High School Diploma

In terms of high school diploma, the demographic groups most similar to Irish are Okinawan (91.4%, a difference of 0.030%), Scottish (91.4%, a difference of 0.030%), Tsimshian (91.3%, a difference of 0.030%), Immigrants from Northern Europe (91.4%, a difference of 0.040%), and English (91.4%, a difference of 0.040%).
DemographicsRating | RankHigh School Diploma
Tlingit-Haida
99.9
/100
|
#28
Exceptional
91.4%
Europeans
99.9
/100
|
#29
Exceptional
91.4%
Iranians
99.9
/100
|
#30
Exceptional
91.4%
Immigrants | Northern Europe
99.9
/100
|
#31
Exceptional
91.4%
English
99.9
/100
|
#32
Exceptional
91.4%
Okinawans
99.9
/100
|
#33
Exceptional
91.4%
Scottish
99.9
/100
|
#34
Exceptional
91.4%
Irish
99.9
/100
|
#35
Exceptional
91.4%
Tsimshian
99.9
/100
|
#36
Exceptional
91.3%
Immigrants | Ireland
99.9
/100
|
#37
Exceptional
91.3%
Immigrants | Scotland
99.8
/100
|
#38
Exceptional
91.3%
Dutch
99.8
/100
|
#39
Exceptional
91.3%
Immigrants | Lithuania
99.8
/100
|
#40
Exceptional
91.3%
Immigrants | Australia
99.8
/100
|
#41
Exceptional
91.3%
Northern Europeans
99.8
/100
|
#42
Exceptional
91.3%

Demographics Similar to Iroquois by High School Diploma

In terms of high school diploma, the demographic groups most similar to Iroquois are Delaware (89.2%, a difference of 0.010%), Immigrants from Morocco (89.2%, a difference of 0.030%), Spanish (89.2%, a difference of 0.030%), Immigrants from Hong Kong (89.3%, a difference of 0.050%), and Nonimmigrants (89.2%, a difference of 0.050%).
DemographicsRating | RankHigh School Diploma
Bermudans
61.1
/100
|
#162
Good
89.3%
Cree
61.1
/100
|
#163
Good
89.3%
Immigrants | Nepal
61.1
/100
|
#164
Good
89.3%
Immigrants | Asia
59.8
/100
|
#165
Average
89.3%
Immigrants | Albania
59.4
/100
|
#166
Average
89.3%
Immigrants | Hong Kong
58.6
/100
|
#167
Average
89.3%
Delaware
55.8
/100
|
#168
Average
89.2%
Iroquois
55.1
/100
|
#169
Average
89.2%
Immigrants | Morocco
53.3
/100
|
#170
Average
89.2%
Spanish
52.9
/100
|
#171
Average
89.2%
Immigrants | Nonimmigrants
51.8
/100
|
#172
Average
89.2%
Immigrants | Indonesia
50.3
/100
|
#173
Average
89.1%
Hmong
50.0
/100
|
#174
Average
89.1%
Immigrants | Western Asia
49.0
/100
|
#175
Average
89.1%
Osage
48.9
/100
|
#176
Average
89.1%