Irish vs Colombian No Schooling Completed
COMPARE
Irish
Colombian
No Schooling Completed
No Schooling Completed Comparison
Irish
Colombians
1.4%
NO SCHOOLING COMPLETED
100.0/ 100
METRIC RATING
12th/ 347
METRIC RANK
2.3%
NO SCHOOLING COMPLETED
3.2/ 100
METRIC RATING
232nd/ 347
METRIC RANK
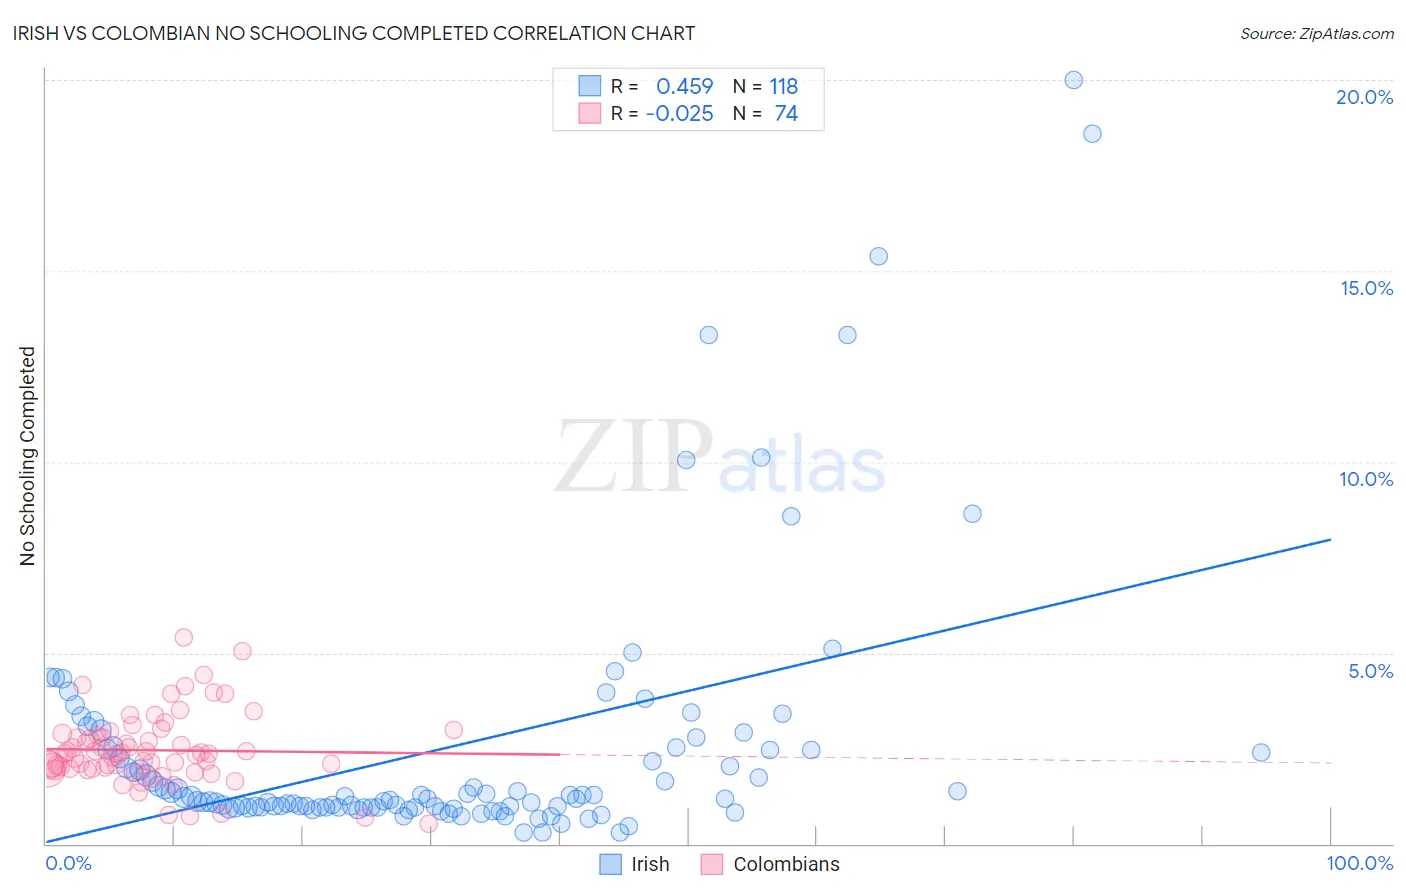
Irish vs Colombian No Schooling Completed Correlation Chart
The statistical analysis conducted on geographies consisting of 558,904,841 people shows a moderate positive correlation between the proportion of Irish and percentage of population with no schooling in the United States with a correlation coefficient (R) of 0.459 and weighted average of 1.4%. Similarly, the statistical analysis conducted on geographies consisting of 415,449,893 people shows no correlation between the proportion of Colombians and percentage of population with no schooling in the United States with a correlation coefficient (R) of -0.025 and weighted average of 2.3%, a difference of 62.2%.
No Schooling Completed Correlation Summary
| Measurement | Irish | Colombian |
| Minimum | 0.30% | 0.52% |
| Maximum | 20.0% | 5.4% |
| Range | 19.7% | 4.9% |
| Mean | 2.5% | 2.5% |
| Median | 1.2% | 2.4% |
| Interquartile 25% (IQ1) | 0.96% | 2.0% |
| Interquartile 75% (IQ3) | 2.5% | 2.8% |
| Interquartile Range (IQR) | 1.5% | 0.88% |
| Standard Deviation (Sample) | 3.4% | 0.93% |
| Standard Deviation (Population) | 3.4% | 0.92% |
Similar Demographics by No Schooling Completed
Demographics Similar to Irish by No Schooling Completed
In terms of no schooling completed, the demographic groups most similar to Irish are Lithuanian (1.4%, a difference of 0.030%), Polish (1.4%, a difference of 0.030%), Dutch (1.4%, a difference of 0.86%), Scotch-Irish (1.5%, a difference of 0.97%), and Tlingit-Haida (1.5%, a difference of 1.0%).
| Demographics | Rating | Rank | No Schooling Completed |
| Slovenes | 100.0 /100 | #5 | Exceptional 1.4% |
| Carpatho Rusyns | 100.0 /100 | #6 | Exceptional 1.4% |
| English | 100.0 /100 | #7 | Exceptional 1.4% |
| Swedes | 100.0 /100 | #8 | Exceptional 1.4% |
| Scottish | 100.0 /100 | #9 | Exceptional 1.4% |
| Dutch | 100.0 /100 | #10 | Exceptional 1.4% |
| Lithuanians | 100.0 /100 | #11 | Exceptional 1.4% |
| Irish | 100.0 /100 | #12 | Exceptional 1.4% |
| Poles | 100.0 /100 | #13 | Exceptional 1.4% |
| Scotch-Irish | 100.0 /100 | #14 | Exceptional 1.5% |
| Tlingit-Haida | 100.0 /100 | #15 | Exceptional 1.5% |
| Finns | 100.0 /100 | #16 | Exceptional 1.5% |
| Croatians | 100.0 /100 | #17 | Exceptional 1.5% |
| Danes | 100.0 /100 | #18 | Exceptional 1.5% |
| Alaskan Athabascans | 100.0 /100 | #19 | Exceptional 1.5% |
Demographics Similar to Colombians by No Schooling Completed
In terms of no schooling completed, the demographic groups most similar to Colombians are Immigrants from Uruguay (2.3%, a difference of 0.22%), Puerto Rican (2.3%, a difference of 0.25%), Immigrants from Malaysia (2.3%, a difference of 0.36%), Immigrants from Pakistan (2.3%, a difference of 0.38%), and U.S. Virgin Islander (2.3%, a difference of 0.47%).
| Demographics | Rating | Rank | No Schooling Completed |
| Sudanese | 4.1 /100 | #225 | Tragic 2.3% |
| Sierra Leoneans | 4.1 /100 | #226 | Tragic 2.3% |
| Immigrants | Uganda | 4.0 /100 | #227 | Tragic 2.3% |
| U.S. Virgin Islanders | 3.7 /100 | #228 | Tragic 2.3% |
| Immigrants | Pakistan | 3.6 /100 | #229 | Tragic 2.3% |
| Puerto Ricans | 3.4 /100 | #230 | Tragic 2.3% |
| Immigrants | Uruguay | 3.4 /100 | #231 | Tragic 2.3% |
| Colombians | 3.2 /100 | #232 | Tragic 2.3% |
| Immigrants | Malaysia | 2.8 /100 | #233 | Tragic 2.3% |
| Nigerians | 2.6 /100 | #234 | Tragic 2.3% |
| Immigrants | Western Asia | 2.6 /100 | #235 | Tragic 2.3% |
| Iraqis | 2.2 /100 | #236 | Tragic 2.4% |
| Immigrants | Eastern Asia | 2.0 /100 | #237 | Tragic 2.4% |
| Paiute | 1.9 /100 | #238 | Tragic 2.4% |
| Liberians | 1.8 /100 | #239 | Tragic 2.4% |