Iraqi vs Nonimmigrants Associate's Degree
COMPARE
Iraqi
Nonimmigrants
Associate's Degree
Associate's Degree Comparison
Iraqis
Nonimmigrants
47.4%
ASSOCIATE'S DEGREE
76.2/ 100
METRIC RATING
150th/ 347
METRIC RANK
42.9%
ASSOCIATE'S DEGREE
1.9/ 100
METRIC RATING
237th/ 347
METRIC RANK
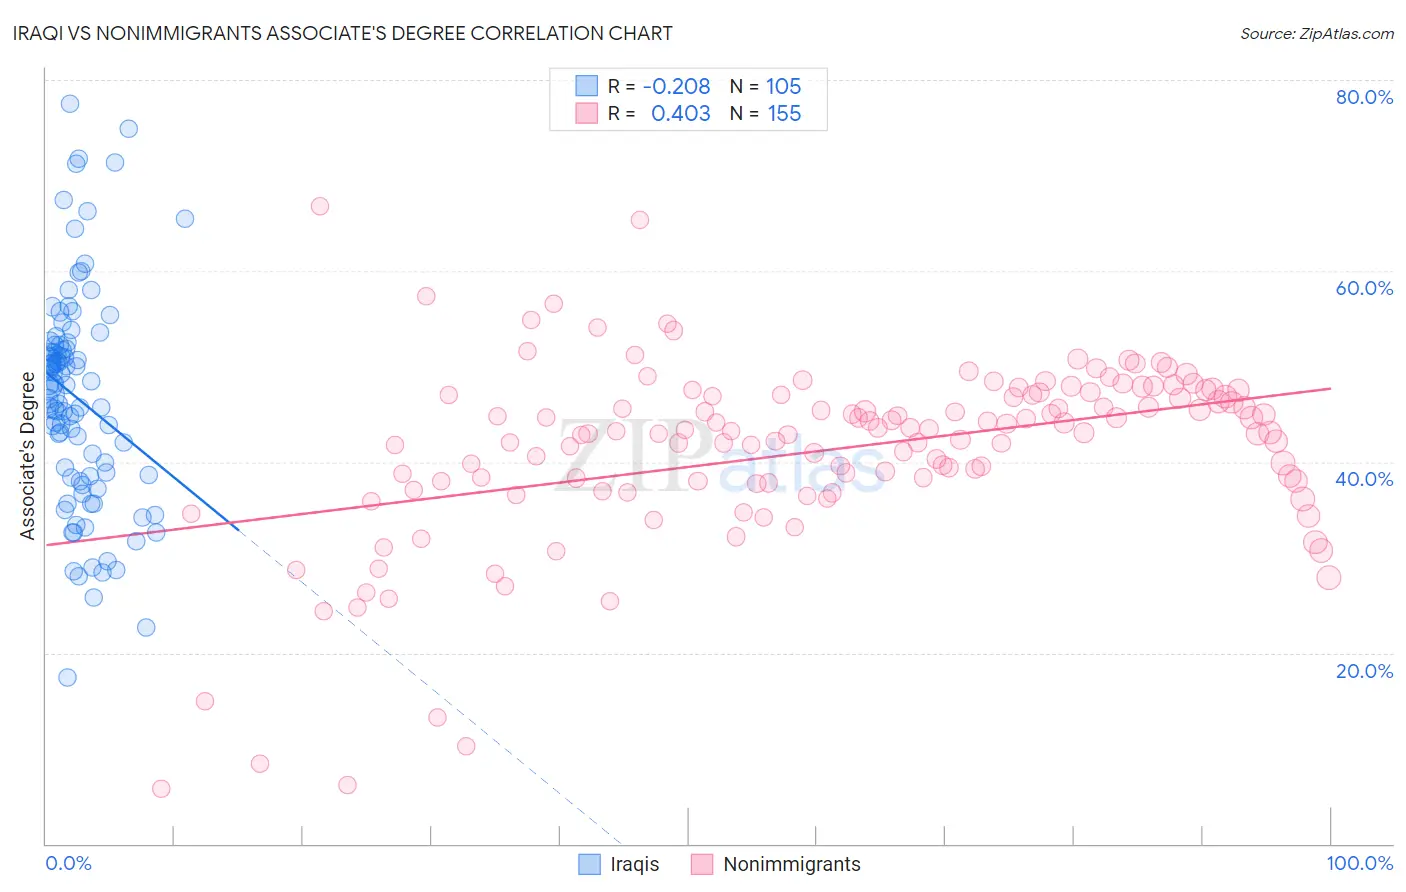
Iraqi vs Nonimmigrants Associate's Degree Correlation Chart
The statistical analysis conducted on geographies consisting of 170,654,197 people shows a weak negative correlation between the proportion of Iraqis and percentage of population with at least associate's degree education in the United States with a correlation coefficient (R) of -0.208 and weighted average of 47.4%. Similarly, the statistical analysis conducted on geographies consisting of 585,078,225 people shows a moderate positive correlation between the proportion of Nonimmigrants and percentage of population with at least associate's degree education in the United States with a correlation coefficient (R) of 0.403 and weighted average of 42.9%, a difference of 10.3%.
Associate's Degree Correlation Summary
| Measurement | Iraqi | Nonimmigrants |
| Minimum | 17.5% | 5.7% |
| Maximum | 77.6% | 66.8% |
| Range | 60.1% | 61.1% |
| Mean | 46.6% | 41.2% |
| Median | 48.1% | 43.1% |
| Interquartile 25% (IQ1) | 38.4% | 37.8% |
| Interquartile 75% (IQ3) | 52.3% | 47.0% |
| Interquartile Range (IQR) | 13.8% | 9.2% |
| Standard Deviation (Sample) | 11.5% | 9.6% |
| Standard Deviation (Population) | 11.4% | 9.6% |
Similar Demographics by Associate's Degree
Demographics Similar to Iraqis by Associate's Degree
In terms of associate's degree, the demographic groups most similar to Iraqis are Immigrants from North Macedonia (47.4%, a difference of 0.020%), Immigrants from Armenia (47.4%, a difference of 0.040%), South American Indian (47.4%, a difference of 0.050%), Danish (47.4%, a difference of 0.11%), and Immigrants from Sudan (47.4%, a difference of 0.17%).
| Demographics | Rating | Rank | Associate's Degree |
| Norwegians | 81.0 /100 | #143 | Excellent 47.6% |
| Slavs | 80.5 /100 | #144 | Excellent 47.6% |
| Canadians | 79.0 /100 | #145 | Good 47.5% |
| Immigrants | Sudan | 77.9 /100 | #146 | Good 47.4% |
| Danes | 77.3 /100 | #147 | Good 47.4% |
| South American Indians | 76.7 /100 | #148 | Good 47.4% |
| Immigrants | Armenia | 76.6 /100 | #149 | Good 47.4% |
| Iraqis | 76.2 /100 | #150 | Good 47.4% |
| Immigrants | North Macedonia | 76.0 /100 | #151 | Good 47.4% |
| Immigrants | Afghanistan | 74.3 /100 | #152 | Good 47.3% |
| Czechs | 72.2 /100 | #153 | Good 47.2% |
| Immigrants | Kenya | 72.1 /100 | #154 | Good 47.2% |
| Kenyans | 70.6 /100 | #155 | Good 47.1% |
| South Americans | 70.5 /100 | #156 | Good 47.1% |
| Sudanese | 70.3 /100 | #157 | Good 47.1% |
Demographics Similar to Nonimmigrants by Associate's Degree
In terms of associate's degree, the demographic groups most similar to Nonimmigrants are Immigrants from St. Vincent and the Grenadines (42.9%, a difference of 0.020%), Ecuadorian (43.0%, a difference of 0.10%), Tlingit-Haida (43.0%, a difference of 0.20%), Iroquois (42.8%, a difference of 0.26%), and Tongan (43.0%, a difference of 0.29%).
| Demographics | Rating | Rank | Associate's Degree |
| Immigrants | Barbados | 2.9 /100 | #230 | Tragic 43.3% |
| Liberians | 2.9 /100 | #231 | Tragic 43.3% |
| Native Hawaiians | 2.3 /100 | #232 | Tragic 43.1% |
| Tongans | 2.2 /100 | #233 | Tragic 43.0% |
| Tlingit-Haida | 2.1 /100 | #234 | Tragic 43.0% |
| Ecuadorians | 2.0 /100 | #235 | Tragic 43.0% |
| Immigrants | St. Vincent and the Grenadines | 1.9 /100 | #236 | Tragic 42.9% |
| Immigrants | Nonimmigrants | 1.9 /100 | #237 | Tragic 42.9% |
| Iroquois | 1.7 /100 | #238 | Tragic 42.8% |
| Immigrants | Grenada | 1.3 /100 | #239 | Tragic 42.6% |
| Cree | 1.2 /100 | #240 | Tragic 42.5% |
| British West Indians | 1.0 /100 | #241 | Tragic 42.4% |
| Immigrants | West Indies | 1.0 /100 | #242 | Tragic 42.4% |
| Guyanese | 1.0 /100 | #243 | Tragic 42.3% |
| Immigrants | Liberia | 0.9 /100 | #244 | Tragic 42.3% |