Iraqi vs Kiowa No Schooling Completed
COMPARE
Iraqi
Kiowa
No Schooling Completed
No Schooling Completed Comparison
Iraqis
Kiowa
2.4%
NO SCHOOLING COMPLETED
2.2/ 100
METRIC RATING
236th/ 347
METRIC RANK
1.6%
NO SCHOOLING COMPLETED
99.8/ 100
METRIC RATING
58th/ 347
METRIC RANK
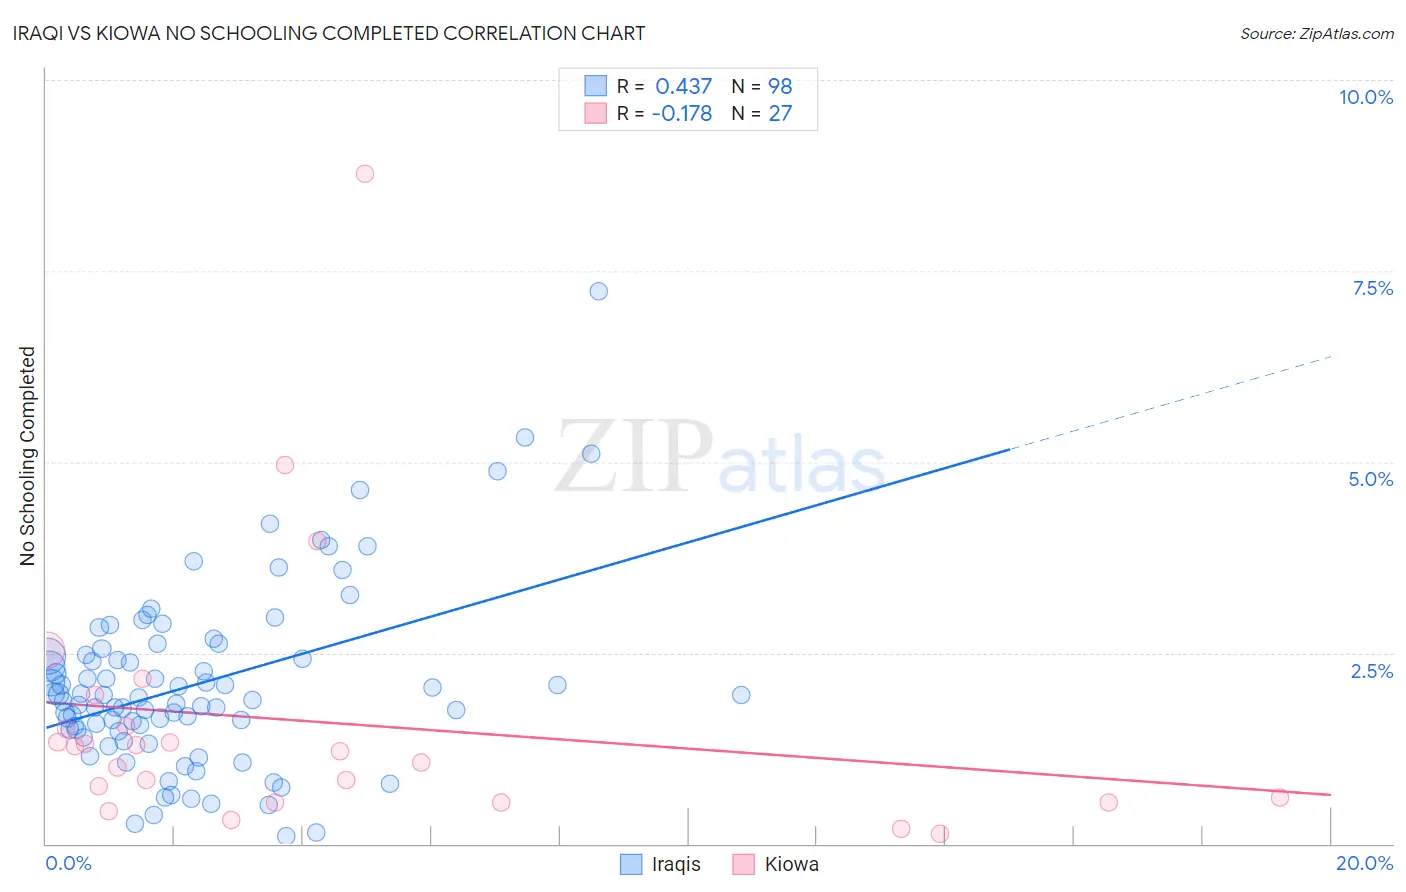
Iraqi vs Kiowa No Schooling Completed Correlation Chart
The statistical analysis conducted on geographies consisting of 170,150,046 people shows a moderate positive correlation between the proportion of Iraqis and percentage of population with no schooling in the United States with a correlation coefficient (R) of 0.437 and weighted average of 2.4%. Similarly, the statistical analysis conducted on geographies consisting of 55,891,433 people shows a poor negative correlation between the proportion of Kiowa and percentage of population with no schooling in the United States with a correlation coefficient (R) of -0.178 and weighted average of 1.6%, a difference of 43.0%.
No Schooling Completed Correlation Summary
| Measurement | Iraqi | Kiowa |
| Minimum | 0.10% | 0.13% |
| Maximum | 7.2% | 8.8% |
| Range | 7.1% | 8.6% |
| Mean | 2.1% | 1.6% |
| Median | 1.9% | 1.2% |
| Interquartile 25% (IQ1) | 1.5% | 0.55% |
| Interquartile 75% (IQ3) | 2.5% | 1.5% |
| Interquartile Range (IQR) | 0.97% | 0.99% |
| Standard Deviation (Sample) | 1.2% | 1.8% |
| Standard Deviation (Population) | 1.2% | 1.8% |
Similar Demographics by No Schooling Completed
Demographics Similar to Iraqis by No Schooling Completed
In terms of no schooling completed, the demographic groups most similar to Iraqis are Immigrants from Eastern Asia (2.4%, a difference of 0.20%), Paiute (2.4%, a difference of 0.41%), Liberian (2.4%, a difference of 0.53%), Immigrants from Western Asia (2.3%, a difference of 0.54%), and Nigerian (2.3%, a difference of 0.56%).
| Demographics | Rating | Rank | No Schooling Completed |
| Immigrants | Pakistan | 3.6 /100 | #229 | Tragic 2.3% |
| Puerto Ricans | 3.4 /100 | #230 | Tragic 2.3% |
| Immigrants | Uruguay | 3.4 /100 | #231 | Tragic 2.3% |
| Colombians | 3.2 /100 | #232 | Tragic 2.3% |
| Immigrants | Malaysia | 2.8 /100 | #233 | Tragic 2.3% |
| Nigerians | 2.6 /100 | #234 | Tragic 2.3% |
| Immigrants | Western Asia | 2.6 /100 | #235 | Tragic 2.3% |
| Iraqis | 2.2 /100 | #236 | Tragic 2.4% |
| Immigrants | Eastern Asia | 2.0 /100 | #237 | Tragic 2.4% |
| Paiute | 1.9 /100 | #238 | Tragic 2.4% |
| Liberians | 1.8 /100 | #239 | Tragic 2.4% |
| Immigrants | Senegal | 1.7 /100 | #240 | Tragic 2.4% |
| Koreans | 1.7 /100 | #241 | Tragic 2.4% |
| Immigrants | Indonesia | 1.5 /100 | #242 | Tragic 2.4% |
| South Americans | 1.5 /100 | #243 | Tragic 2.4% |
Demographics Similar to Kiowa by No Schooling Completed
In terms of no schooling completed, the demographic groups most similar to Kiowa are Slavic (1.7%, a difference of 0.070%), Austrian (1.6%, a difference of 0.16%), American (1.7%, a difference of 0.19%), Immigrants from North America (1.6%, a difference of 0.46%), and Greek (1.6%, a difference of 0.47%).
| Demographics | Rating | Rank | No Schooling Completed |
| Chippewa | 99.8 /100 | #51 | Exceptional 1.6% |
| Immigrants | Canada | 99.8 /100 | #52 | Exceptional 1.6% |
| Creek | 99.8 /100 | #53 | Exceptional 1.6% |
| Crow | 99.8 /100 | #54 | Exceptional 1.6% |
| Greeks | 99.8 /100 | #55 | Exceptional 1.6% |
| Immigrants | North America | 99.8 /100 | #56 | Exceptional 1.6% |
| Austrians | 99.8 /100 | #57 | Exceptional 1.6% |
| Kiowa | 99.8 /100 | #58 | Exceptional 1.6% |
| Slavs | 99.8 /100 | #59 | Exceptional 1.7% |
| Americans | 99.8 /100 | #60 | Exceptional 1.7% |
| Tsimshian | 99.8 /100 | #61 | Exceptional 1.7% |
| Immigrants | Northern Europe | 99.8 /100 | #62 | Exceptional 1.7% |
| Russians | 99.8 /100 | #63 | Exceptional 1.7% |
| New Zealanders | 99.7 /100 | #64 | Exceptional 1.7% |
| Serbians | 99.7 /100 | #65 | Exceptional 1.7% |