Iraqi vs Immigrants from Belize Professional Degree
COMPARE
Iraqi
Immigrants from Belize
Professional Degree
Professional Degree Comparison
Iraqis
Immigrants from Belize
4.5%
PROFESSIONAL DEGREE
69.8/ 100
METRIC RATING
157th/ 347
METRIC RANK
3.5%
PROFESSIONAL DEGREE
0.3/ 100
METRIC RATING
292nd/ 347
METRIC RANK
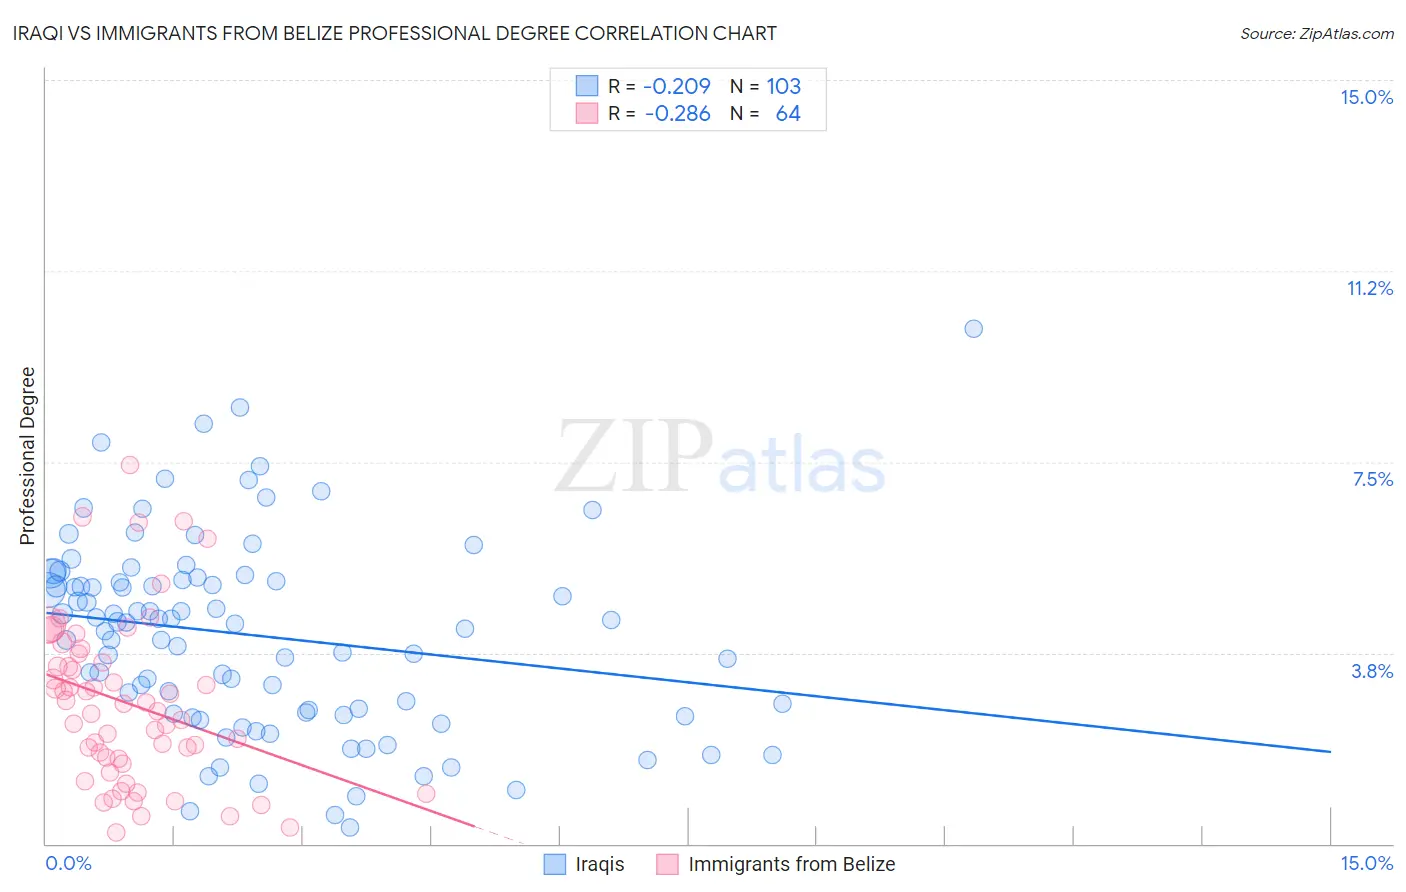
Iraqi vs Immigrants from Belize Professional Degree Correlation Chart
The statistical analysis conducted on geographies consisting of 170,610,184 people shows a weak negative correlation between the proportion of Iraqis and percentage of population with at least professional degree education in the United States with a correlation coefficient (R) of -0.209 and weighted average of 4.5%. Similarly, the statistical analysis conducted on geographies consisting of 130,267,931 people shows a weak negative correlation between the proportion of Immigrants from Belize and percentage of population with at least professional degree education in the United States with a correlation coefficient (R) of -0.286 and weighted average of 3.5%, a difference of 31.2%.
Professional Degree Correlation Summary
| Measurement | Iraqi | Immigrants from Belize |
| Minimum | 0.32% | 0.23% |
| Maximum | 10.1% | 7.4% |
| Range | 9.8% | 7.2% |
| Mean | 4.1% | 2.8% |
| Median | 4.3% | 2.7% |
| Interquartile 25% (IQ1) | 2.6% | 1.6% |
| Interquartile 75% (IQ3) | 5.2% | 3.7% |
| Interquartile Range (IQR) | 2.6% | 2.0% |
| Standard Deviation (Sample) | 1.9% | 1.6% |
| Standard Deviation (Population) | 1.9% | 1.6% |
Similar Demographics by Professional Degree
Demographics Similar to Iraqis by Professional Degree
In terms of professional degree, the demographic groups most similar to Iraqis are Swedish (4.5%, a difference of 0.010%), Slavic (4.5%, a difference of 0.16%), Immigrants from Armenia (4.5%, a difference of 0.17%), Vietnamese (4.5%, a difference of 0.24%), and Immigrants from Senegal (4.5%, a difference of 0.30%).
| Demographics | Rating | Rank | Professional Degree |
| Immigrants | Oceania | 73.4 /100 | #150 | Good 4.6% |
| Poles | 72.6 /100 | #151 | Good 4.6% |
| Immigrants | Africa | 72.5 /100 | #152 | Good 4.6% |
| Immigrants | Uruguay | 72.5 /100 | #153 | Good 4.6% |
| Scottish | 71.8 /100 | #154 | Good 4.6% |
| Slavs | 70.8 /100 | #155 | Good 4.5% |
| Swedes | 69.9 /100 | #156 | Good 4.5% |
| Iraqis | 69.8 /100 | #157 | Good 4.5% |
| Immigrants | Armenia | 68.8 /100 | #158 | Good 4.5% |
| Vietnamese | 68.4 /100 | #159 | Good 4.5% |
| Immigrants | Senegal | 68.0 /100 | #160 | Good 4.5% |
| Assyrians/Chaldeans/Syriacs | 67.4 /100 | #161 | Good 4.5% |
| Peruvians | 65.2 /100 | #162 | Good 4.5% |
| Sierra Leoneans | 64.3 /100 | #163 | Good 4.5% |
| Swiss | 61.0 /100 | #164 | Good 4.5% |
Demographics Similar to Immigrants from Belize by Professional Degree
In terms of professional degree, the demographic groups most similar to Immigrants from Belize are Alaska Native (3.5%, a difference of 0.070%), Chippewa (3.5%, a difference of 0.24%), Immigrants from Honduras (3.5%, a difference of 0.24%), Guatemalan (3.5%, a difference of 0.25%), and Paiute (3.4%, a difference of 0.32%).
| Demographics | Rating | Rank | Professional Degree |
| Hondurans | 0.3 /100 | #285 | Tragic 3.5% |
| Haitians | 0.3 /100 | #286 | Tragic 3.5% |
| Immigrants | El Salvador | 0.3 /100 | #287 | Tragic 3.5% |
| Blackfeet | 0.3 /100 | #288 | Tragic 3.5% |
| Guatemalans | 0.3 /100 | #289 | Tragic 3.5% |
| Chippewa | 0.3 /100 | #290 | Tragic 3.5% |
| Alaska Natives | 0.3 /100 | #291 | Tragic 3.5% |
| Immigrants | Belize | 0.3 /100 | #292 | Tragic 3.5% |
| Immigrants | Honduras | 0.3 /100 | #293 | Tragic 3.5% |
| Paiute | 0.3 /100 | #294 | Tragic 3.4% |
| Immigrants | Guatemala | 0.2 /100 | #295 | Tragic 3.4% |
| Hawaiians | 0.2 /100 | #296 | Tragic 3.4% |
| Immigrants | Liberia | 0.2 /100 | #297 | Tragic 3.4% |
| Ottawa | 0.2 /100 | #298 | Tragic 3.4% |
| Immigrants | Yemen | 0.2 /100 | #299 | Tragic 3.4% |