Iranian vs French American Indian Associate's Degree
COMPARE
Iranian
French American Indian
Associate's Degree
Associate's Degree Comparison
Iranians
French American Indians
58.2%
ASSOCIATE'S DEGREE
100.0/ 100
METRIC RATING
5th/ 347
METRIC RANK
42.0%
ASSOCIATE'S DEGREE
0.6/ 100
METRIC RATING
252nd/ 347
METRIC RANK
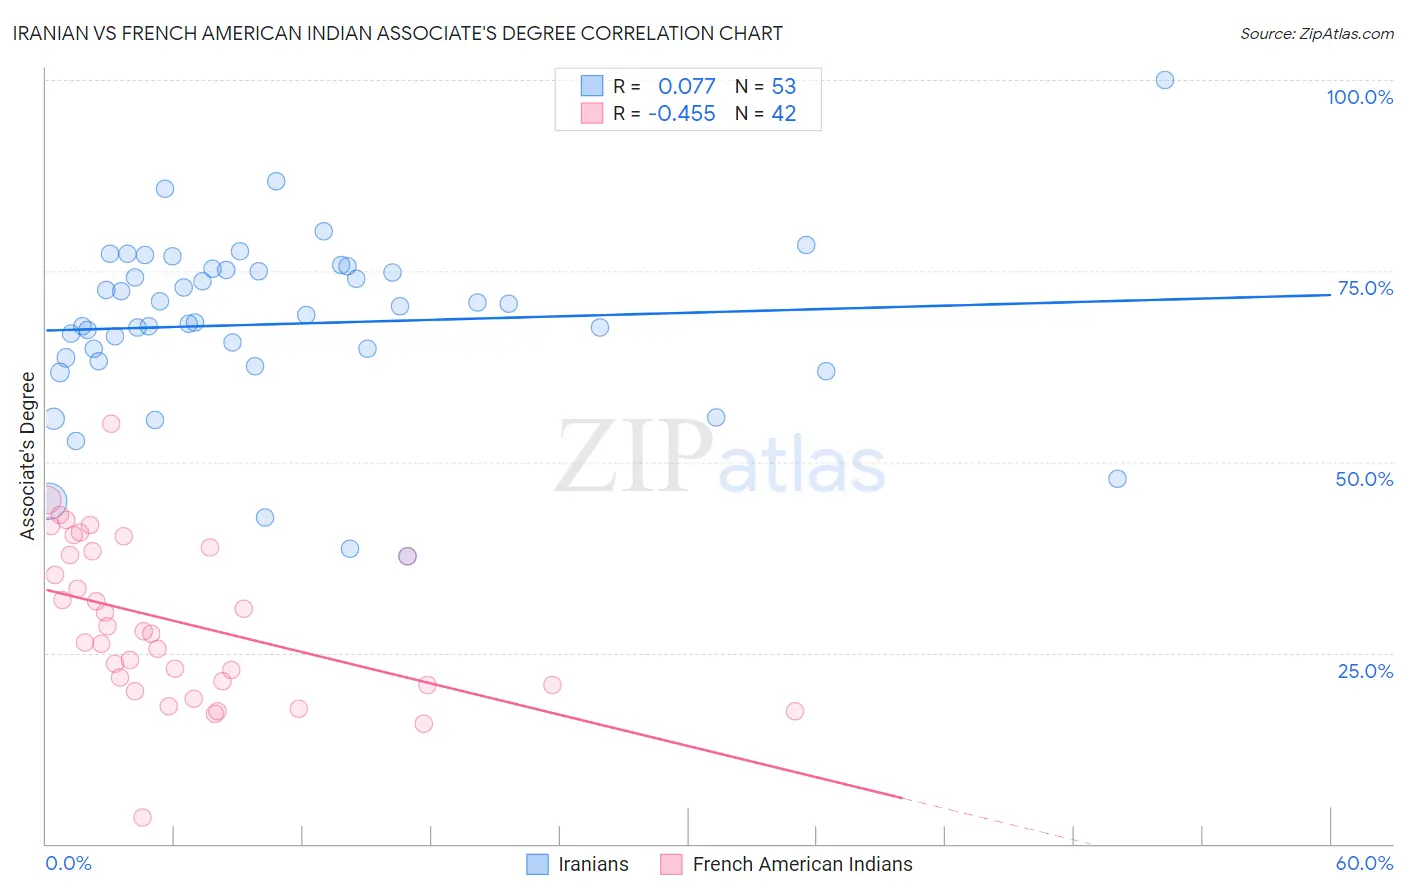
Iranian vs French American Indian Associate's Degree Correlation Chart
The statistical analysis conducted on geographies consisting of 316,879,465 people shows a slight positive correlation between the proportion of Iranians and percentage of population with at least associate's degree education in the United States with a correlation coefficient (R) of 0.077 and weighted average of 58.2%. Similarly, the statistical analysis conducted on geographies consisting of 131,974,565 people shows a moderate negative correlation between the proportion of French American Indians and percentage of population with at least associate's degree education in the United States with a correlation coefficient (R) of -0.455 and weighted average of 42.0%, a difference of 38.6%.
Associate's Degree Correlation Summary
| Measurement | Iranian | French American Indian |
| Minimum | 37.7% | 3.4% |
| Maximum | 100.0% | 55.0% |
| Range | 62.3% | 51.5% |
| Mean | 68.1% | 29.1% |
| Median | 69.2% | 27.6% |
| Interquartile 25% (IQ1) | 63.4% | 20.8% |
| Interquartile 75% (IQ3) | 75.2% | 38.3% |
| Interquartile Range (IQR) | 11.8% | 17.5% |
| Standard Deviation (Sample) | 11.7% | 10.5% |
| Standard Deviation (Population) | 11.6% | 10.4% |
Similar Demographics by Associate's Degree
Demographics Similar to Iranians by Associate's Degree
In terms of associate's degree, the demographic groups most similar to Iranians are Immigrants from Taiwan (58.4%, a difference of 0.41%), Immigrants from India (58.5%, a difference of 0.66%), Okinawan (57.7%, a difference of 0.83%), Immigrants from Iran (57.7%, a difference of 0.89%), and Thai (57.4%, a difference of 1.3%).
| Demographics | Rating | Rank | Associate's Degree |
| Filipinos | 100.0 /100 | #1 | Exceptional 59.8% |
| Immigrants | Singapore | 100.0 /100 | #2 | Exceptional 58.9% |
| Immigrants | India | 100.0 /100 | #3 | Exceptional 58.5% |
| Immigrants | Taiwan | 100.0 /100 | #4 | Exceptional 58.4% |
| Iranians | 100.0 /100 | #5 | Exceptional 58.2% |
| Okinawans | 100.0 /100 | #6 | Exceptional 57.7% |
| Immigrants | Iran | 100.0 /100 | #7 | Exceptional 57.7% |
| Thais | 100.0 /100 | #8 | Exceptional 57.4% |
| Immigrants | Israel | 100.0 /100 | #9 | Exceptional 56.8% |
| Cypriots | 100.0 /100 | #10 | Exceptional 56.4% |
| Immigrants | Australia | 100.0 /100 | #11 | Exceptional 55.8% |
| Immigrants | South Central Asia | 100.0 /100 | #12 | Exceptional 55.7% |
| Immigrants | China | 100.0 /100 | #13 | Exceptional 55.5% |
| Immigrants | Hong Kong | 100.0 /100 | #14 | Exceptional 55.4% |
| Immigrants | Eastern Asia | 100.0 /100 | #15 | Exceptional 55.4% |
Demographics Similar to French American Indians by Associate's Degree
In terms of associate's degree, the demographic groups most similar to French American Indians are Indonesian (41.9%, a difference of 0.10%), Cuban (41.9%, a difference of 0.17%), Immigrants from Guyana (41.8%, a difference of 0.25%), Immigrants from Bahamas (42.1%, a difference of 0.36%), and U.S. Virgin Islander (42.1%, a difference of 0.38%).
| Demographics | Rating | Rank | Associate's Degree |
| Immigrants | Cambodia | 0.9 /100 | #245 | Tragic 42.3% |
| Delaware | 0.9 /100 | #246 | Tragic 42.3% |
| Immigrants | Fiji | 0.8 /100 | #247 | Tragic 42.2% |
| Immigrants | Ecuador | 0.8 /100 | #248 | Tragic 42.2% |
| Jamaicans | 0.7 /100 | #249 | Tragic 42.1% |
| U.S. Virgin Islanders | 0.7 /100 | #250 | Tragic 42.1% |
| Immigrants | Bahamas | 0.7 /100 | #251 | Tragic 42.1% |
| French American Indians | 0.6 /100 | #252 | Tragic 42.0% |
| Indonesians | 0.6 /100 | #253 | Tragic 41.9% |
| Cubans | 0.6 /100 | #254 | Tragic 41.9% |
| Immigrants | Guyana | 0.5 /100 | #255 | Tragic 41.8% |
| Immigrants | Congo | 0.5 /100 | #256 | Tragic 41.8% |
| Spanish Americans | 0.5 /100 | #257 | Tragic 41.8% |
| Japanese | 0.5 /100 | #258 | Tragic 41.7% |
| Malaysians | 0.4 /100 | #259 | Tragic 41.6% |