Inupiat vs Immigrants from Ireland Professional Degree
COMPARE
Inupiat
Immigrants from Ireland
Professional Degree
Professional Degree Comparison
Inupiat
Immigrants from Ireland
3.2%
PROFESSIONAL DEGREE
0.0/ 100
METRIC RATING
323rd/ 347
METRIC RANK
6.3%
PROFESSIONAL DEGREE
100.0/ 100
METRIC RATING
25th/ 347
METRIC RANK
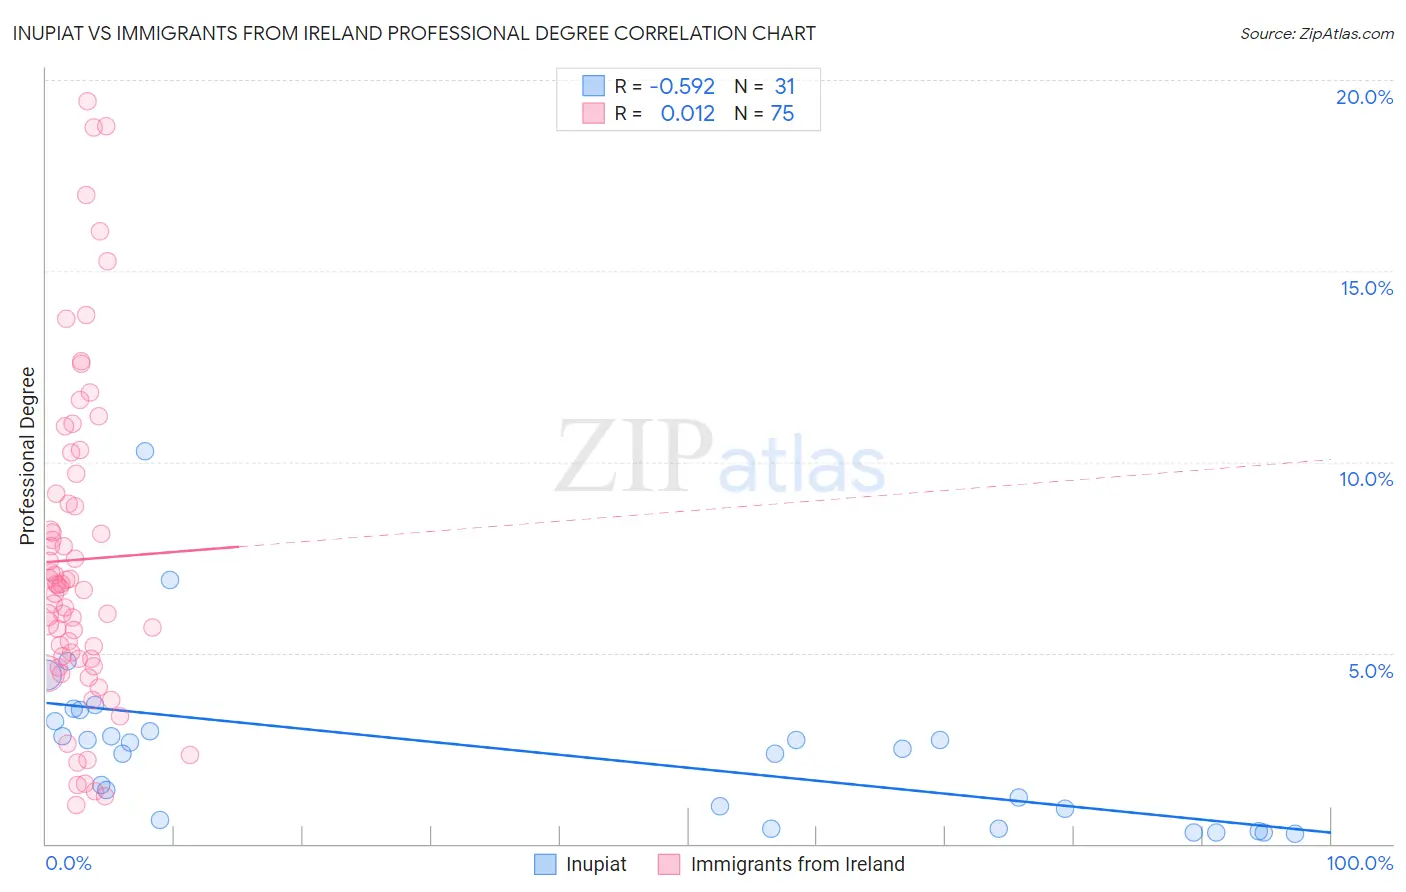
Inupiat vs Immigrants from Ireland Professional Degree Correlation Chart
The statistical analysis conducted on geographies consisting of 96,206,613 people shows a substantial negative correlation between the proportion of Inupiat and percentage of population with at least professional degree education in the United States with a correlation coefficient (R) of -0.592 and weighted average of 3.2%. Similarly, the statistical analysis conducted on geographies consisting of 240,598,418 people shows no correlation between the proportion of Immigrants from Ireland and percentage of population with at least professional degree education in the United States with a correlation coefficient (R) of 0.012 and weighted average of 6.3%, a difference of 98.9%.
Professional Degree Correlation Summary
| Measurement | Inupiat | Immigrants from Ireland |
| Minimum | 0.27% | 1.0% |
| Maximum | 10.3% | 19.5% |
| Range | 10.0% | 18.4% |
| Mean | 2.4% | 7.4% |
| Median | 2.5% | 6.7% |
| Interquartile 25% (IQ1) | 0.64% | 4.9% |
| Interquartile 75% (IQ3) | 3.2% | 9.2% |
| Interquartile Range (IQR) | 2.6% | 4.3% |
| Standard Deviation (Sample) | 2.1% | 4.2% |
| Standard Deviation (Population) | 2.1% | 4.2% |
Similar Demographics by Professional Degree
Demographics Similar to Inupiat by Professional Degree
In terms of professional degree, the demographic groups most similar to Inupiat are Hispanic or Latino (3.2%, a difference of 0.080%), Crow (3.2%, a difference of 0.27%), Yaqui (3.2%, a difference of 0.34%), Tsimshian (3.2%, a difference of 0.44%), and Seminole (3.2%, a difference of 0.80%).
| Demographics | Rating | Rank | Professional Degree |
| Puerto Ricans | 0.1 /100 | #316 | Tragic 3.2% |
| Nepalese | 0.1 /100 | #317 | Tragic 3.2% |
| Immigrants | Micronesia | 0.1 /100 | #318 | Tragic 3.2% |
| Choctaw | 0.1 /100 | #319 | Tragic 3.2% |
| Seminole | 0.1 /100 | #320 | Tragic 3.2% |
| Tsimshian | 0.0 /100 | #321 | Tragic 3.2% |
| Hispanics or Latinos | 0.0 /100 | #322 | Tragic 3.2% |
| Inupiat | 0.0 /100 | #323 | Tragic 3.2% |
| Crow | 0.0 /100 | #324 | Tragic 3.2% |
| Yaqui | 0.0 /100 | #325 | Tragic 3.2% |
| Menominee | 0.0 /100 | #326 | Tragic 3.1% |
| Dutch West Indians | 0.0 /100 | #327 | Tragic 3.1% |
| Creek | 0.0 /100 | #328 | Tragic 3.1% |
| Bangladeshis | 0.0 /100 | #329 | Tragic 3.1% |
| Immigrants | Cabo Verde | 0.0 /100 | #330 | Tragic 3.1% |
Demographics Similar to Immigrants from Ireland by Professional Degree
In terms of professional degree, the demographic groups most similar to Immigrants from Ireland are Immigrants from Spain (6.3%, a difference of 0.49%), Russian (6.3%, a difference of 0.53%), Latvian (6.2%, a difference of 0.88%), Immigrants from Japan (6.4%, a difference of 1.0%), and Immigrants from Northern Europe (6.2%, a difference of 1.4%).
| Demographics | Rating | Rank | Professional Degree |
| Soviet Union | 100.0 /100 | #18 | Exceptional 6.6% |
| Indians (Asian) | 100.0 /100 | #19 | Exceptional 6.5% |
| Immigrants | Denmark | 100.0 /100 | #20 | Exceptional 6.4% |
| Immigrants | Hong Kong | 100.0 /100 | #21 | Exceptional 6.4% |
| Immigrants | Japan | 100.0 /100 | #22 | Exceptional 6.4% |
| Russians | 100.0 /100 | #23 | Exceptional 6.3% |
| Immigrants | Spain | 100.0 /100 | #24 | Exceptional 6.3% |
| Immigrants | Ireland | 100.0 /100 | #25 | Exceptional 6.3% |
| Latvians | 100.0 /100 | #26 | Exceptional 6.2% |
| Immigrants | Northern Europe | 100.0 /100 | #27 | Exceptional 6.2% |
| Turks | 100.0 /100 | #28 | Exceptional 6.2% |
| Immigrants | Sri Lanka | 100.0 /100 | #29 | Exceptional 6.2% |
| Immigrants | Turkey | 100.0 /100 | #30 | Exceptional 6.2% |
| Immigrants | India | 100.0 /100 | #31 | Exceptional 6.2% |
| Thais | 100.0 /100 | #32 | Exceptional 6.1% |