Indonesian vs Immigrants from Liberia 4th Grade
COMPARE
Indonesian
Immigrants from Liberia
4th Grade
4th Grade Comparison
Indonesians
Immigrants from Liberia
96.2%
4TH GRADE
0.0/ 100
METRIC RATING
313th/ 347
METRIC RANK
97.1%
4TH GRADE
0.8/ 100
METRIC RATING
253rd/ 347
METRIC RANK
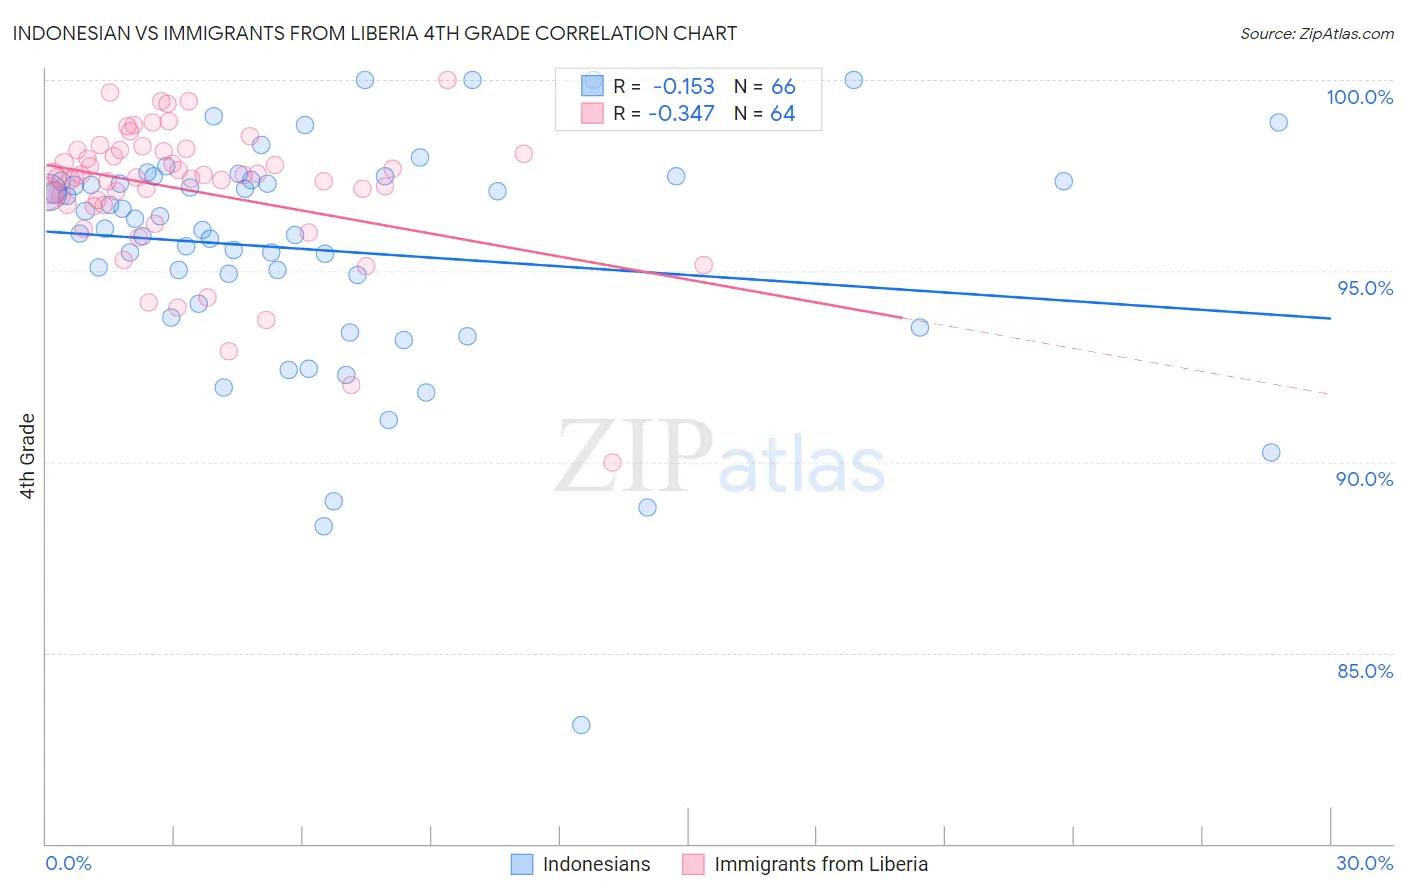
Indonesian vs Immigrants from Liberia 4th Grade Correlation Chart
The statistical analysis conducted on geographies consisting of 162,727,113 people shows a poor negative correlation between the proportion of Indonesians and percentage of population with at least 4th grade education in the United States with a correlation coefficient (R) of -0.153 and weighted average of 96.2%. Similarly, the statistical analysis conducted on geographies consisting of 135,294,272 people shows a mild negative correlation between the proportion of Immigrants from Liberia and percentage of population with at least 4th grade education in the United States with a correlation coefficient (R) of -0.347 and weighted average of 97.1%, a difference of 0.89%.
4th Grade Correlation Summary
| Measurement | Indonesian | Immigrants from Liberia |
| Minimum | 83.1% | 90.0% |
| Maximum | 100.0% | 100.0% |
| Range | 16.9% | 10.0% |
| Mean | 95.5% | 97.1% |
| Median | 96.2% | 97.4% |
| Interquartile 25% (IQ1) | 94.1% | 96.7% |
| Interquartile 75% (IQ3) | 97.4% | 98.1% |
| Interquartile Range (IQR) | 3.2% | 1.4% |
| Standard Deviation (Sample) | 3.1% | 1.8% |
| Standard Deviation (Population) | 3.1% | 1.8% |
Similar Demographics by 4th Grade
Demographics Similar to Indonesians by 4th Grade
In terms of 4th grade, the demographic groups most similar to Indonesians are Vietnamese (96.2%, a difference of 0.0%), Nicaraguan (96.2%, a difference of 0.010%), Immigrants from Ecuador (96.2%, a difference of 0.010%), Immigrants from Bangladesh (96.2%, a difference of 0.020%), and Cape Verdean (96.2%, a difference of 0.020%).
| Demographics | Rating | Rank | 4th Grade |
| Sri Lankans | 0.0 /100 | #306 | Tragic 96.4% |
| Immigrants | Haiti | 0.0 /100 | #307 | Tragic 96.3% |
| Immigrants | Laos | 0.0 /100 | #308 | Tragic 96.3% |
| Immigrants | Guyana | 0.0 /100 | #309 | Tragic 96.3% |
| Immigrants | Burma/Myanmar | 0.0 /100 | #310 | Tragic 96.3% |
| Immigrants | Bangladesh | 0.0 /100 | #311 | Tragic 96.2% |
| Cape Verdeans | 0.0 /100 | #312 | Tragic 96.2% |
| Indonesians | 0.0 /100 | #313 | Tragic 96.2% |
| Vietnamese | 0.0 /100 | #314 | Tragic 96.2% |
| Nicaraguans | 0.0 /100 | #315 | Tragic 96.2% |
| Immigrants | Ecuador | 0.0 /100 | #316 | Tragic 96.2% |
| Central American Indians | 0.0 /100 | #317 | Tragic 96.2% |
| Immigrants | Azores | 0.0 /100 | #318 | Tragic 96.1% |
| Belizeans | 0.0 /100 | #319 | Tragic 96.1% |
| Bangladeshis | 0.0 /100 | #320 | Tragic 96.1% |
Demographics Similar to Immigrants from Liberia by 4th Grade
In terms of 4th grade, the demographic groups most similar to Immigrants from Liberia are South American (97.1%, a difference of 0.0%), Jamaican (97.1%, a difference of 0.0%), Immigrants from Middle Africa (97.1%, a difference of 0.0%), Immigrants from Africa (97.1%, a difference of 0.010%), and Immigrants from Senegal (97.1%, a difference of 0.010%).
| Demographics | Rating | Rank | 4th Grade |
| Immigrants | Uruguay | 1.2 /100 | #246 | Tragic 97.1% |
| Ethiopians | 1.2 /100 | #247 | Tragic 97.1% |
| Immigrants | Asia | 1.2 /100 | #248 | Tragic 97.1% |
| Immigrants | Africa | 1.0 /100 | #249 | Tragic 97.1% |
| Immigrants | Senegal | 0.9 /100 | #250 | Tragic 97.1% |
| South Americans | 0.8 /100 | #251 | Tragic 97.1% |
| Jamaicans | 0.8 /100 | #252 | Tragic 97.1% |
| Immigrants | Liberia | 0.8 /100 | #253 | Tragic 97.1% |
| Immigrants | Middle Africa | 0.8 /100 | #254 | Tragic 97.1% |
| Peruvians | 0.7 /100 | #255 | Tragic 97.1% |
| Bolivians | 0.7 /100 | #256 | Tragic 97.1% |
| Immigrants | Congo | 0.5 /100 | #257 | Tragic 97.0% |
| Immigrants | Colombia | 0.5 /100 | #258 | Tragic 97.0% |
| Immigrants | Ethiopia | 0.4 /100 | #259 | Tragic 97.0% |
| Immigrants | Sierra Leone | 0.4 /100 | #260 | Tragic 97.0% |