Indonesian vs Armenian 7th Grade
COMPARE
Indonesian
Armenian
7th Grade
7th Grade Comparison
Indonesians
Armenians
94.5%
7TH GRADE
0.0/ 100
METRIC RATING
298th/ 347
METRIC RANK
95.0%
7TH GRADE
0.1/ 100
METRIC RATING
284th/ 347
METRIC RANK
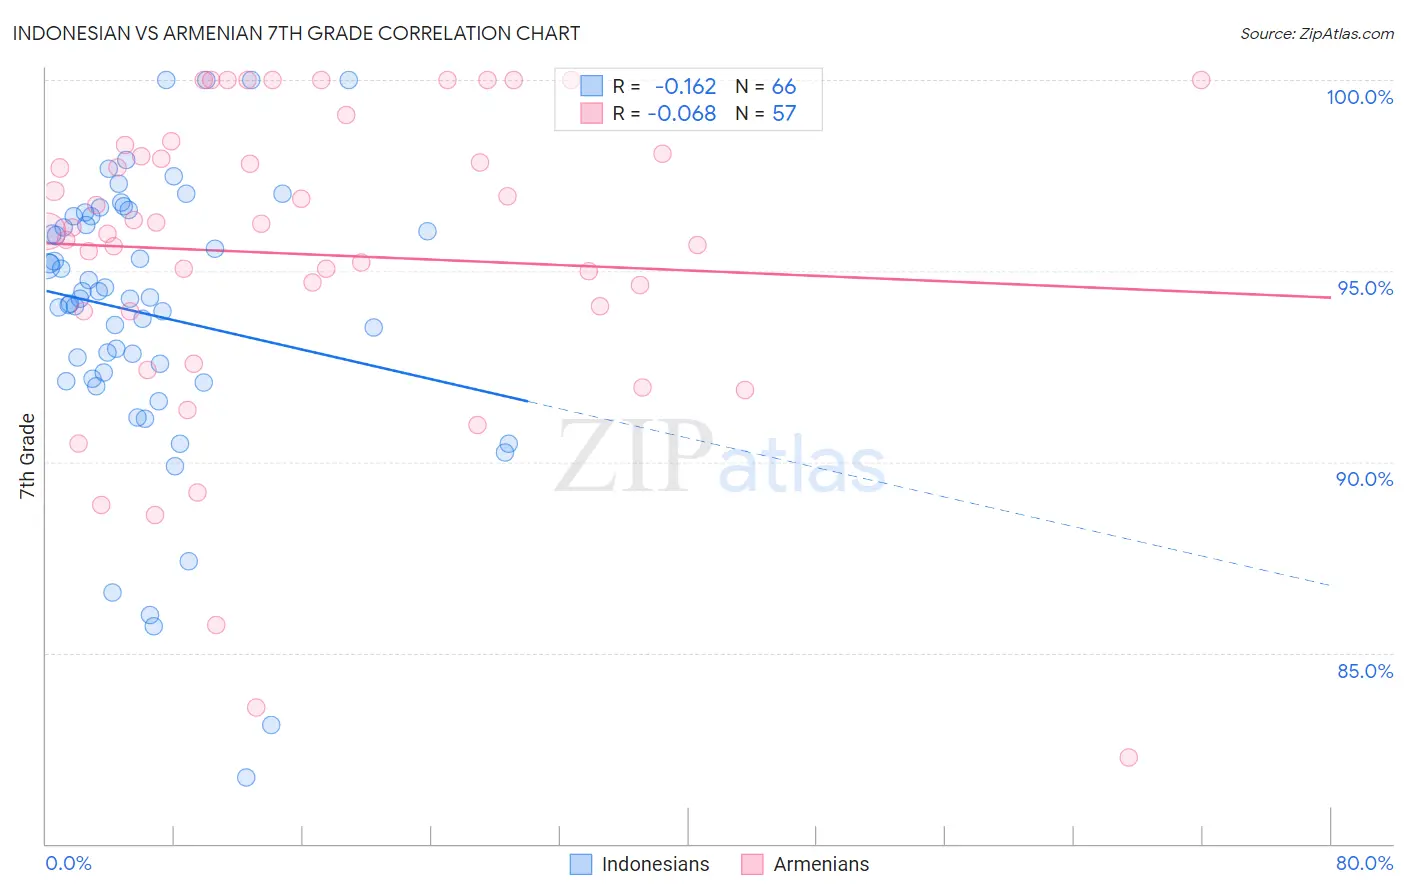
Indonesian vs Armenian 7th Grade Correlation Chart
The statistical analysis conducted on geographies consisting of 162,727,113 people shows a poor negative correlation between the proportion of Indonesians and percentage of population with at least 7th grade education in the United States with a correlation coefficient (R) of -0.162 and weighted average of 94.5%. Similarly, the statistical analysis conducted on geographies consisting of 310,954,801 people shows a slight negative correlation between the proportion of Armenians and percentage of population with at least 7th grade education in the United States with a correlation coefficient (R) of -0.068 and weighted average of 95.0%, a difference of 0.46%.
7th Grade Correlation Summary
| Measurement | Indonesian | Armenian |
| Minimum | 81.7% | 82.3% |
| Maximum | 100.0% | 100.0% |
| Range | 18.3% | 17.7% |
| Mean | 93.9% | 95.4% |
| Median | 94.3% | 96.1% |
| Interquartile 25% (IQ1) | 92.2% | 94.0% |
| Interquartile 75% (IQ3) | 96.4% | 98.2% |
| Interquartile Range (IQR) | 4.3% | 4.2% |
| Standard Deviation (Sample) | 3.7% | 4.1% |
| Standard Deviation (Population) | 3.7% | 4.1% |
Demographics Similar to Indonesians and Armenians by 7th Grade
In terms of 7th grade, the demographic groups most similar to Indonesians are Immigrants from South Eastern Asia (94.5%, a difference of 0.0%), Bangladeshi (94.5%, a difference of 0.010%), Immigrants from Burma/Myanmar (94.5%, a difference of 0.040%), Immigrants from Dominica (94.5%, a difference of 0.070%), and Yaqui (94.6%, a difference of 0.11%). Similarly, the demographic groups most similar to Armenians are Immigrants from Barbados (95.0%, a difference of 0.0%), Immigrants from Eritrea (94.9%, a difference of 0.010%), Immigrants from Bolivia (95.0%, a difference of 0.060%), Tohono O'odham (95.0%, a difference of 0.070%), and Immigrants from Philippines (94.9%, a difference of 0.090%).
| Demographics | Rating | Rank | 7th Grade |
| Tohono O'odham | 0.1 /100 | #281 | Tragic 95.0% |
| Immigrants | Bolivia | 0.1 /100 | #282 | Tragic 95.0% |
| Immigrants | Barbados | 0.1 /100 | #283 | Tragic 95.0% |
| Armenians | 0.1 /100 | #284 | Tragic 95.0% |
| Immigrants | Eritrea | 0.1 /100 | #285 | Tragic 94.9% |
| Immigrants | Philippines | 0.0 /100 | #286 | Tragic 94.9% |
| Immigrants | Peru | 0.0 /100 | #287 | Tragic 94.9% |
| British West Indians | 0.0 /100 | #288 | Tragic 94.8% |
| Taiwanese | 0.0 /100 | #289 | Tragic 94.8% |
| Malaysians | 0.0 /100 | #290 | Tragic 94.8% |
| Immigrants | Grenada | 0.0 /100 | #291 | Tragic 94.8% |
| Immigrants | West Indies | 0.0 /100 | #292 | Tragic 94.8% |
| Fijians | 0.0 /100 | #293 | Tragic 94.7% |
| Haitians | 0.0 /100 | #294 | Tragic 94.7% |
| Yaqui | 0.0 /100 | #295 | Tragic 94.6% |
| Cubans | 0.0 /100 | #296 | Tragic 94.6% |
| Immigrants | South Eastern Asia | 0.0 /100 | #297 | Tragic 94.5% |
| Indonesians | 0.0 /100 | #298 | Tragic 94.5% |
| Bangladeshis | 0.0 /100 | #299 | Tragic 94.5% |
| Immigrants | Burma/Myanmar | 0.0 /100 | #300 | Tragic 94.5% |
| Immigrants | Dominica | 0.0 /100 | #301 | Tragic 94.5% |