Indian (Asian) vs Puerto Rican Doctorate Degree

COMPARE

Indian (Asian)
Race
Ancestry
AfghanAfricanAlaska NativeAlaskan AthabascanAlbanianAleutAlsatianAmericanApacheArabArapahoArgentineanArmenianAssyrian/Chaldean/SyriacAustralianAustrianBahamianBangladeshiBarbadianBasqueBelgianBelizeanBermudanBhutaneseBlackfeetBolivianBrazilianBritishBritish West IndianBulgarianBurmeseCajunCambodianCanadianCape VerdeanCarpatho RusynCelticCentral AmericanCentral American IndianCherokeeCheyenneChickasawChileanChineseChippewaChoctawColombianColvilleComancheCosta RicanCreeCreekCroatianCrowCubanCypriotCzechCzechoslovakianDanishDelawareDominicanDutchDutch West IndianEastern EuropeanEcuadorianEgyptianEnglishEstonianEthiopianEuropeanFijianFilipinoFinnishFrenchFrench American IndianFrench CanadianGermanGerman RussianGhanaianGreekGuamanian/ChamorroGuatemalanGuyaneseHaitianHmongHonduranHopiHoumaHungarianIcelanderIndian (Asian)IndonesianInupiatIranianIraqiIrishIroquoisIsraeliItalianJamaicanJapaneseJordanianKenyanKiowaKoreanLaotianLatvianLebaneseLiberianLithuanianLumbeeLuxembourgerMacedonianMalaysianMalteseMarshalleseMenomineeMexicanMexican American IndianMongolianMoroccanNative HawaiianNavajoNepaleseNew ZealanderNicaraguanNigerianNorthern EuropeanNorwegianOkinawanOsageOttawaPaiutePakistaniPalestinianPanamanianParaguayanPennsylvania GermanPeruvianPimaPolishPortuguesePotawatomiPuebloPuget Sound SalishRomanianRussianSalvadoranSamoanScandinavianScotch-IrishScottishSeminoleSenegaleseSerbianShoshoneSierra LeoneanSiouxSlavicSlovakSloveneSomaliSouth AfricanSouth AmericanSouth American IndianSoviet UnionSpaniardSpanishSpanish AmericanSpanish American IndianSri LankanSubsaharan AfricanSudaneseSwedishSwissSyrianTaiwaneseThaiTlingit-HaidaTohono O'OdhamTonganTrinidadian and TobagonianTsimshianTurkishU.S. Virgin IslanderUgandanUkrainianUruguayanUteVenezuelanVietnameseWelshWest IndianYakamaYaquiYugoslavianYumanYup'ikZimbabwean
Immigration
NonimmigrantsImmigrantsAfghanistanAfricaAlbaniaArgentinaArmeniaAsiaAustraliaAustriaBahamasBangladeshBarbadosBelarusBelgiumBelizeBoliviaBosnia and HerzegovinaBrazilBulgariaBurma/MyanmarCabo VerdeCambodiaCameroonCanadaCaribbeanCentral AmericaChileChinaColombiaCongoCosta RicaCroatiaCubaCzechoslovakiaDenmarkDominicaDominican RepublicEastern AfricaEastern AsiaEastern EuropeEcuadorEgyptEl SalvadorEnglandEritreaEthiopiaEuropeFijiFranceGermanyGhanaGreeceGrenadaGuatemalaGuyanaHaitiHondurasHong KongHungaryIndiaIndonesiaIranIraqIrelandIsraelItalyJamaicaJapanJordanKazakhstanKenyaKoreaKuwaitLaosLatin AmericaLatviaLebanonLiberiaLithuaniaMalaysiaMexicoMicronesiaMiddle AfricaMoldovaMoroccoNepalNetherlandsNicaraguaNigeriaNorth AmericaNorth MacedoniaNorthern AfricaNorthern EuropeNorwayOceaniaPakistanPanamaPeruPhilippinesPolandPortugalRomaniaRussiaSaudi ArabiaScotlandSenegalSerbiaSierra LeoneSingaporeSomaliaSouth AfricaSouth AmericaSouth Central AsiaSouth Eastern AsiaSouthern EuropeSpainSri LankaSt. Vincent and the GrenadinesSudanSwedenSwitzerlandSyriaTaiwanThailandTrinidad and TobagoTurkeyUgandaUkraineUruguayUzbekistanVenezuelaVietnamWest IndiesWestern AfricaWestern AsiaWestern EuropeYemenZaireZimbabweAzores
Puerto Rican
Race
Ancestry
AfghanAfricanAlaska NativeAlaskan AthabascanAlbanianAleutAlsatianAmericanApacheArabArapahoArgentineanArmenianAssyrian/Chaldean/SyriacAustralianAustrianBahamianBangladeshiBarbadianBasqueBelgianBelizeanBermudanBhutaneseBlackfeetBolivianBrazilianBritishBritish West IndianBulgarianBurmeseCajunCambodianCanadianCape VerdeanCarpatho RusynCelticCentral AmericanCentral American IndianCherokeeCheyenneChickasawChileanChineseChippewaChoctawColombianColvilleComancheCosta RicanCreeCreekCroatianCrowCubanCypriotCzechCzechoslovakianDanishDelawareDominicanDutchDutch West IndianEastern EuropeanEcuadorianEgyptianEnglishEstonianEthiopianEuropeanFijianFilipinoFinnishFrenchFrench American IndianFrench CanadianGermanGerman RussianGhanaianGreekGuamanian/ChamorroGuatemalanGuyaneseHaitianHmongHonduranHopiHoumaHungarianIcelanderIndonesianInupiatIranianIraqiIrishIroquoisIsraeliItalianJamaicanJapaneseJordanianKenyanKiowaKoreanLaotianLatvianLebaneseLiberianLithuanianLumbeeLuxembourgerMacedonianMalaysianMalteseMarshalleseMenomineeMexicanMexican American IndianMongolianMoroccanNative HawaiianNavajoNepaleseNew ZealanderNicaraguanNigerianNorthern EuropeanNorwegianOkinawanOsageOttawaPaiutePakistaniPalestinianPanamanianParaguayanPennsylvania GermanPeruvianPimaPolishPortuguesePotawatomiPuebloPuerto RicanPuget Sound SalishRomanianRussianSalvadoranSamoanScandinavianScotch-IrishScottishSeminoleSenegaleseSerbianShoshoneSierra LeoneanSiouxSlavicSlovakSloveneSomaliSouth AfricanSouth AmericanSouth American IndianSoviet UnionSpaniardSpanishSpanish AmericanSpanish American IndianSri LankanSubsaharan AfricanSudaneseSwedishSwissSyrianTaiwaneseThaiTlingit-HaidaTohono O'OdhamTonganTrinidadian and TobagonianTsimshianTurkishU.S. Virgin IslanderUgandanUkrainianUruguayanUteVenezuelanVietnameseWelshWest IndianYakamaYaquiYugoslavianYumanYup'ikZimbabwean
Immigration
NonimmigrantsImmigrantsAfghanistanAfricaAlbaniaArgentinaArmeniaAsiaAustraliaAustriaBahamasBangladeshBarbadosBelarusBelgiumBelizeBoliviaBosnia and HerzegovinaBrazilBulgariaBurma/MyanmarCabo VerdeCambodiaCameroonCanadaCaribbeanCentral AmericaChileChinaColombiaCongoCosta RicaCroatiaCubaCzechoslovakiaDenmarkDominicaDominican RepublicEastern AfricaEastern AsiaEastern EuropeEcuadorEgyptEl SalvadorEnglandEritreaEthiopiaEuropeFijiFranceGermanyGhanaGreeceGrenadaGuatemalaGuyanaHaitiHondurasHong KongHungaryIndiaIndonesiaIranIraqIrelandIsraelItalyJamaicaJapanJordanKazakhstanKenyaKoreaKuwaitLaosLatin AmericaLatviaLebanonLiberiaLithuaniaMalaysiaMexicoMicronesiaMiddle AfricaMoldovaMoroccoNepalNetherlandsNicaraguaNigeriaNorth AmericaNorth MacedoniaNorthern AfricaNorthern EuropeNorwayOceaniaPakistanPanamaPeruPhilippinesPolandPortugalRomaniaRussiaSaudi ArabiaScotlandSenegalSerbiaSierra LeoneSingaporeSomaliaSouth AfricaSouth AmericaSouth Central AsiaSouth Eastern AsiaSouthern EuropeSpainSri LankaSt. Vincent and the GrenadinesSudanSwedenSwitzerlandSyriaTaiwanThailandTrinidad and TobagoTurkeyUgandaUkraineUruguayUzbekistanVenezuelaVietnamWest IndiesWestern AfricaWestern AsiaWestern EuropeYemenZaireZimbabweAzores
Doctorate Degree
Income
Poverty
Unemployment
Labor Participation
Family Structure
Vehicle Availability
Education Level
Disability

Doctorate Degree Comparison

Indians (Asian)

Puerto Ricans

Exceptional
Tragic
2.9%
DOCTORATE DEGREE
100.0/ 100
METRIC RATING
11th/ 347
METRIC RANK
1.4%
DOCTORATE DEGREE
0.1/ 100
METRIC RATING
298th/ 347
METRIC RANK

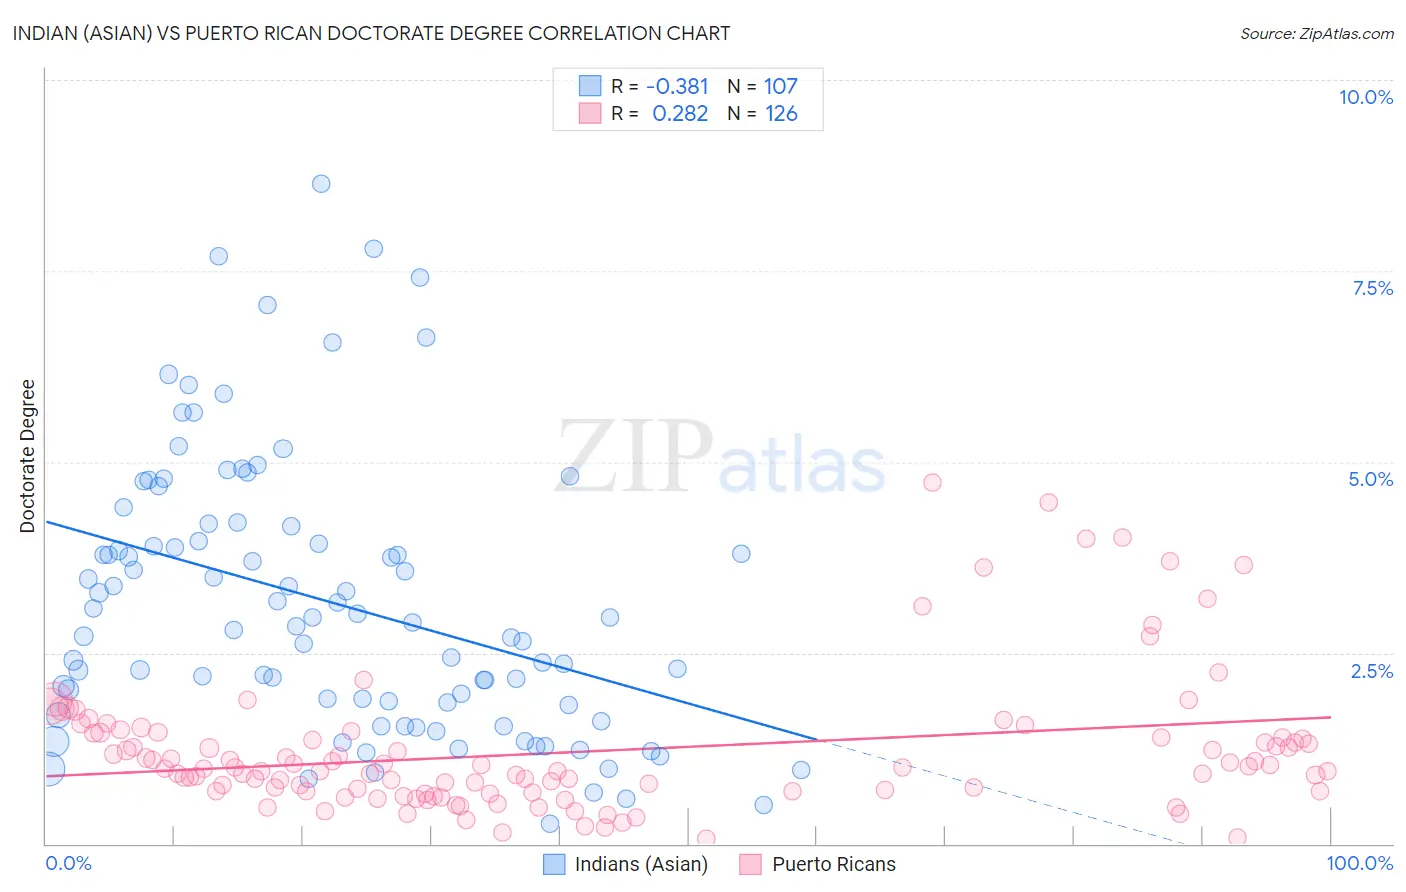
Indian (Asian) vs Puerto Rican Doctorate Degree Correlation Chart

The statistical analysis conducted on geographies consisting of 487,771,448 people shows a mild negative correlation between the proportion of Indians (Asian) and percentage of population with at least doctorate degree education in the United States with a correlation coefficient (R) of -0.381 and weighted average of 2.9%. Similarly, the statistical analysis conducted on geographies consisting of 514,802,619 people shows a weak positive correlation between the proportion of Puerto Ricans and percentage of population with at least doctorate degree education in the United States with a correlation coefficient (R) of 0.282 and weighted average of 1.4%, a difference of 107.9%.
Indian (Asian) vs Puerto Rican Doctorate Degree

Doctorate Degree Correlation Summary

MeasurementIndian (Asian)Puerto Rican
Minimum0.26%0.063%
Maximum8.6%4.7%
Range8.4%4.7%
Mean3.2%1.2%
Median2.9%0.99%
Interquartile 25% (IQ1)1.8%0.69%
Interquartile 75% (IQ3)4.2%1.4%
Interquartile Range (IQR)2.3%0.71%
Standard Deviation (Sample)1.8%0.89%
Standard Deviation (Population)1.8%0.89%

Similar Demographics by Doctorate Degree

Demographics Similar to Indians (Asian) by Doctorate Degree

In terms of doctorate degree, the demographic groups most similar to Indians (Asian) are Immigrants from Belgium (2.9%, a difference of 0.66%), Immigrants from Sweden (2.9%, a difference of 1.6%), Immigrants from France (2.9%, a difference of 1.7%), Immigrants from Eastern Asia (3.0%, a difference of 1.8%), and Immigrants from India (2.8%, a difference of 2.8%).
DemographicsRating | RankDoctorate Degree
Immigrants | Taiwan
100.0
/100
|
#4
Exceptional
3.2%
Iranians
100.0
/100
|
#5
Exceptional
3.1%
Immigrants | Switzerland
100.0
/100
|
#6
Exceptional
3.1%
Immigrants | China
100.0
/100
|
#7
Exceptional
3.1%
Immigrants | Israel
100.0
/100
|
#8
Exceptional
3.0%
Immigrants | Iran
100.0
/100
|
#9
Exceptional
3.0%
Immigrants | Eastern Asia
100.0
/100
|
#10
Exceptional
3.0%
Indians (Asian)
100.0
/100
|
#11
Exceptional
2.9%
Immigrants | Belgium
100.0
/100
|
#12
Exceptional
2.9%
Immigrants | Sweden
100.0
/100
|
#13
Exceptional
2.9%
Immigrants | France
100.0
/100
|
#14
Exceptional
2.9%
Immigrants | India
100.0
/100
|
#15
Exceptional
2.8%
Eastern Europeans
100.0
/100
|
#16
Exceptional
2.8%
Immigrants | Australia
100.0
/100
|
#17
Exceptional
2.8%
Immigrants | Sri Lanka
100.0
/100
|
#18
Exceptional
2.8%

Demographics Similar to Puerto Ricans by Doctorate Degree

In terms of doctorate degree, the demographic groups most similar to Puerto Ricans are Tsimshian (1.4%, a difference of 0.41%), Belizean (1.4%, a difference of 0.43%), Immigrants from Ecuador (1.4%, a difference of 0.63%), Immigrants from Guatemala (1.4%, a difference of 0.76%), and Honduran (1.4%, a difference of 0.83%).
DemographicsRating | RankDoctorate Degree
Blacks/African Americans
0.3
/100
|
#291
Tragic
1.4%
Alaska Natives
0.3
/100
|
#292
Tragic
1.4%
Immigrants | Yemen
0.2
/100
|
#293
Tragic
1.4%
Samoans
0.2
/100
|
#294
Tragic
1.4%
Guatemalans
0.2
/100
|
#295
Tragic
1.4%
Immigrants | Ecuador
0.2
/100
|
#296
Tragic
1.4%
Tsimshian
0.2
/100
|
#297
Tragic
1.4%
Puerto Ricans
0.1
/100
|
#298
Tragic
1.4%
Belizeans
0.1
/100
|
#299
Tragic
1.4%
Immigrants | Guatemala
0.1
/100
|
#300
Tragic
1.4%
Hondurans
0.1
/100
|
#301
Tragic
1.4%
Shoshone
0.1
/100
|
#302
Tragic
1.4%
Immigrants | Dominica
0.1
/100
|
#303
Tragic
1.4%
Mexican American Indians
0.1
/100
|
#304
Tragic
1.4%
Pennsylvania Germans
0.1
/100
|
#305
Tragic
1.4%