Indian (Asian) vs German Russian 12th Grade, No Diploma
COMPARE
Indian (Asian)
German Russian
12th Grade, No Diploma
12th Grade, No Diploma Comparison
Indians (Asian)
German Russians
91.5%
12TH GRADE, NO DIPLOMA
79.4/ 100
METRIC RATING
148th/ 347
METRIC RANK
91.8%
12TH GRADE, NO DIPLOMA
89.8/ 100
METRIC RATING
129th/ 347
METRIC RANK
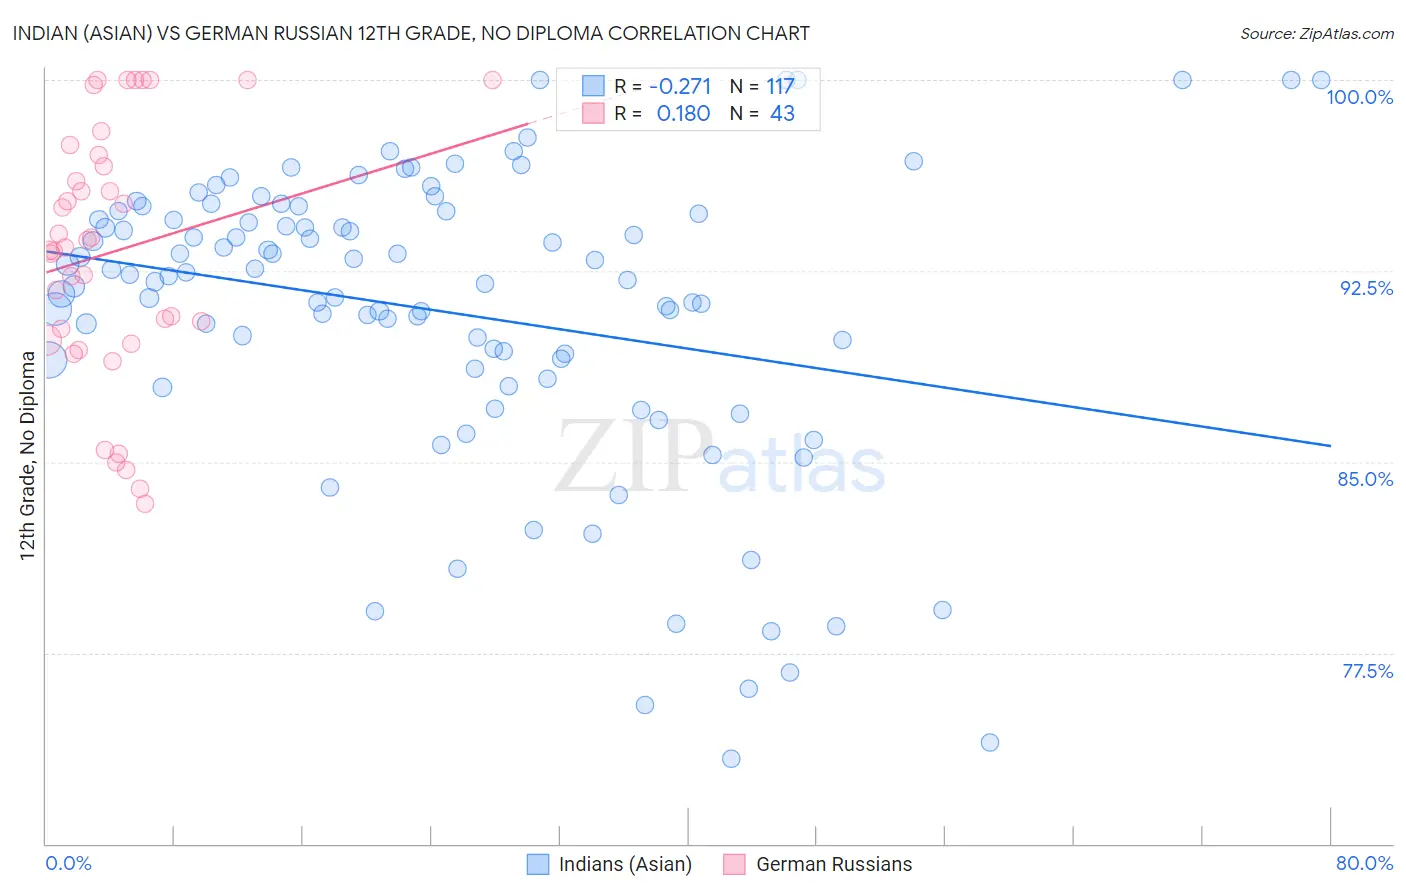
Indian (Asian) vs German Russian 12th Grade, No Diploma Correlation Chart
The statistical analysis conducted on geographies consisting of 495,348,141 people shows a weak negative correlation between the proportion of Indians (Asian) and percentage of population with at least 12th grade (no diploma) education in the United States with a correlation coefficient (R) of -0.271 and weighted average of 91.5%. Similarly, the statistical analysis conducted on geographies consisting of 96,461,984 people shows a poor positive correlation between the proportion of German Russians and percentage of population with at least 12th grade (no diploma) education in the United States with a correlation coefficient (R) of 0.180 and weighted average of 91.8%, a difference of 0.25%.
12th Grade, No Diploma Correlation Summary
| Measurement | Indian (Asian) | German Russian |
| Minimum | 73.3% | 83.3% |
| Maximum | 100.0% | 100.0% |
| Range | 26.7% | 16.7% |
| Mean | 90.9% | 93.2% |
| Median | 92.3% | 93.4% |
| Interquartile 25% (IQ1) | 88.8% | 89.8% |
| Interquartile 75% (IQ3) | 94.8% | 97.1% |
| Interquartile Range (IQR) | 5.9% | 7.3% |
| Standard Deviation (Sample) | 5.9% | 4.9% |
| Standard Deviation (Population) | 5.9% | 4.9% |
Demographics Similar to Indians (Asian) and German Russians by 12th Grade, No Diploma
In terms of 12th grade, no diploma, the demographic groups most similar to Indians (Asian) are Pakistani (91.5%, a difference of 0.0%), Immigrants from Spain (91.6%, a difference of 0.010%), Immigrants from Lebanon (91.6%, a difference of 0.010%), Immigrants from Brazil (91.5%, a difference of 0.010%), and Immigrants from Venezuela (91.6%, a difference of 0.030%). Similarly, the demographic groups most similar to German Russians are Assyrian/Chaldean/Syriac (91.8%, a difference of 0.0%), Mongolian (91.8%, a difference of 0.010%), Albanian (91.8%, a difference of 0.010%), Immigrants from Eastern Asia (91.8%, a difference of 0.020%), and Immigrants from Italy (91.7%, a difference of 0.050%).
| Demographics | Rating | Rank | 12th Grade, No Diploma |
| Mongolians | 89.9 /100 | #128 | Excellent 91.8% |
| German Russians | 89.8 /100 | #129 | Excellent 91.8% |
| Assyrians/Chaldeans/Syriacs | 89.6 /100 | #130 | Excellent 91.8% |
| Albanians | 89.3 /100 | #131 | Excellent 91.8% |
| Immigrants | Eastern Asia | 89.3 /100 | #132 | Excellent 91.8% |
| Immigrants | Italy | 88.3 /100 | #133 | Excellent 91.7% |
| Venezuelans | 88.2 /100 | #134 | Excellent 91.7% |
| Immigrants | Bosnia and Herzegovina | 87.3 /100 | #135 | Excellent 91.7% |
| Chileans | 85.8 /100 | #136 | Excellent 91.7% |
| Alaska Natives | 84.9 /100 | #137 | Excellent 91.6% |
| Arabs | 84.1 /100 | #138 | Excellent 91.6% |
| Immigrants | Egypt | 83.9 /100 | #139 | Excellent 91.6% |
| Immigrants | Poland | 82.3 /100 | #140 | Excellent 91.6% |
| Argentineans | 82.0 /100 | #141 | Excellent 91.6% |
| Immigrants | Venezuela | 80.9 /100 | #142 | Excellent 91.6% |
| Immigrants | Argentina | 80.7 /100 | #143 | Excellent 91.6% |
| Immigrants | Spain | 80.1 /100 | #144 | Excellent 91.6% |
| Immigrants | Lebanon | 80.0 /100 | #145 | Excellent 91.6% |
| Immigrants | Brazil | 79.8 /100 | #146 | Good 91.5% |
| Pakistanis | 79.6 /100 | #147 | Good 91.5% |
| Indians (Asian) | 79.4 /100 | #148 | Good 91.5% |