Indian (Asian) vs Alaska Native Professional Degree
COMPARE
Indian (Asian)
Alaska Native
Professional Degree
Professional Degree Comparison
Indians (Asian)
Alaska Natives
6.5%
PROFESSIONAL DEGREE
100.0/ 100
METRIC RATING
19th/ 347
METRIC RANK
3.5%
PROFESSIONAL DEGREE
0.3/ 100
METRIC RATING
291st/ 347
METRIC RANK
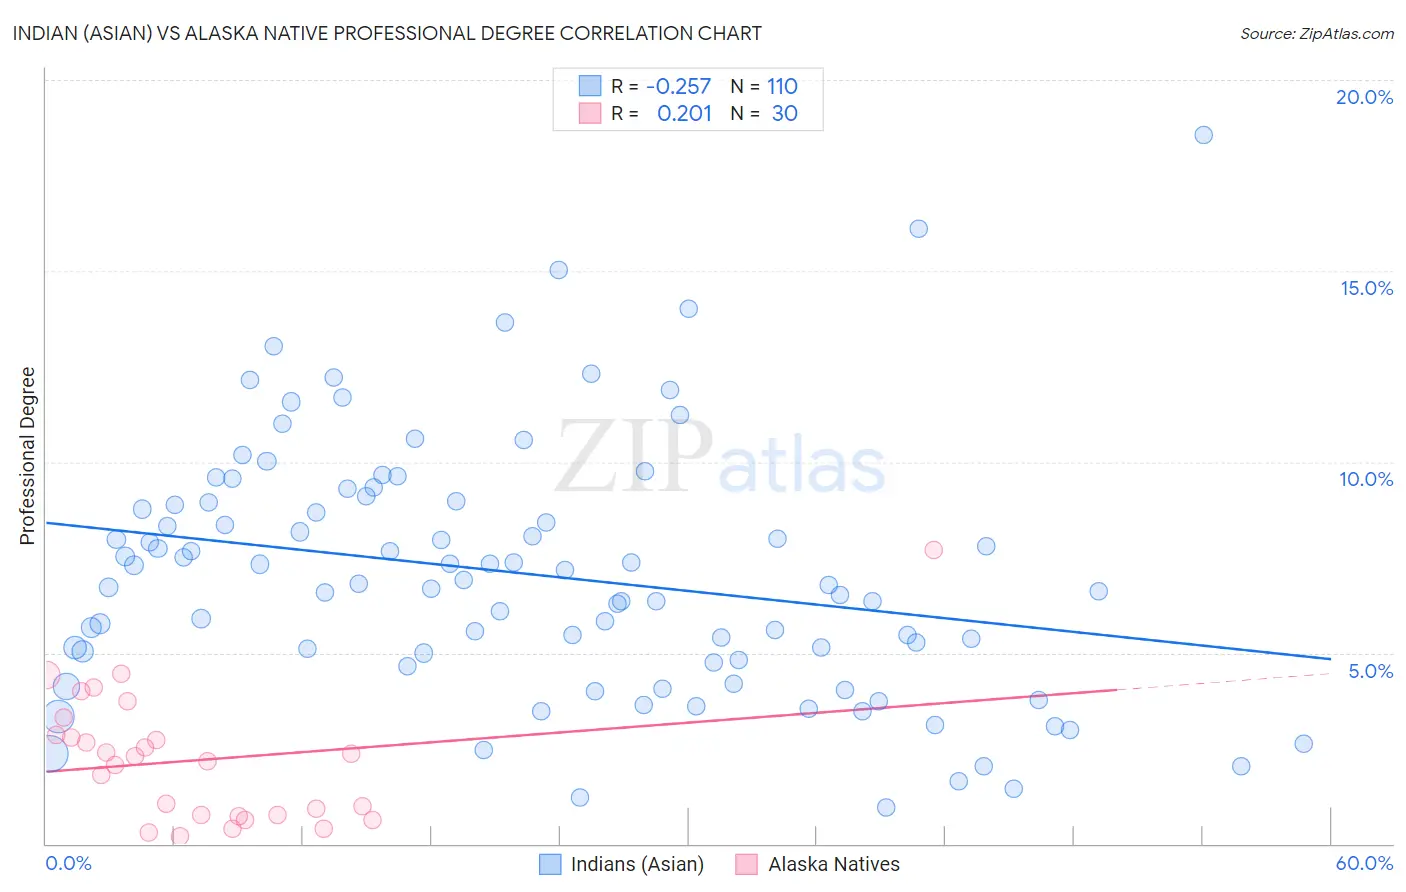
Indian (Asian) vs Alaska Native Professional Degree Correlation Chart
The statistical analysis conducted on geographies consisting of 493,505,427 people shows a weak negative correlation between the proportion of Indians (Asian) and percentage of population with at least professional degree education in the United States with a correlation coefficient (R) of -0.257 and weighted average of 6.5%. Similarly, the statistical analysis conducted on geographies consisting of 76,648,508 people shows a weak positive correlation between the proportion of Alaska Natives and percentage of population with at least professional degree education in the United States with a correlation coefficient (R) of 0.201 and weighted average of 3.5%, a difference of 88.4%.
Professional Degree Correlation Summary
| Measurement | Indian (Asian) | Alaska Native |
| Minimum | 0.96% | 0.21% |
| Maximum | 18.6% | 7.7% |
| Range | 17.6% | 7.5% |
| Mean | 7.1% | 2.2% |
| Median | 6.8% | 2.2% |
| Interquartile 25% (IQ1) | 4.8% | 0.74% |
| Interquartile 75% (IQ3) | 8.9% | 2.9% |
| Interquartile Range (IQR) | 4.1% | 2.1% |
| Standard Deviation (Sample) | 3.3% | 1.7% |
| Standard Deviation (Population) | 3.3% | 1.7% |
Similar Demographics by Professional Degree
Demographics Similar to Indians (Asian) by Professional Degree
In terms of professional degree, the demographic groups most similar to Indians (Asian) are Soviet Union (6.6%, a difference of 0.66%), Immigrants from Eastern Asia (6.6%, a difference of 0.68%), Immigrants from Denmark (6.4%, a difference of 1.5%), Immigrants from Hong Kong (6.4%, a difference of 1.8%), and Immigrants from Japan (6.4%, a difference of 2.5%).
| Demographics | Rating | Rank | Professional Degree |
| Israelis | 100.0 /100 | #12 | Exceptional 6.9% |
| Immigrants | Australia | 100.0 /100 | #13 | Exceptional 6.9% |
| Immigrants | France | 100.0 /100 | #14 | Exceptional 6.8% |
| Immigrants | China | 100.0 /100 | #15 | Exceptional 6.7% |
| Immigrants | Sweden | 100.0 /100 | #16 | Exceptional 6.7% |
| Immigrants | Eastern Asia | 100.0 /100 | #17 | Exceptional 6.6% |
| Soviet Union | 100.0 /100 | #18 | Exceptional 6.6% |
| Indians (Asian) | 100.0 /100 | #19 | Exceptional 6.5% |
| Immigrants | Denmark | 100.0 /100 | #20 | Exceptional 6.4% |
| Immigrants | Hong Kong | 100.0 /100 | #21 | Exceptional 6.4% |
| Immigrants | Japan | 100.0 /100 | #22 | Exceptional 6.4% |
| Russians | 100.0 /100 | #23 | Exceptional 6.3% |
| Immigrants | Spain | 100.0 /100 | #24 | Exceptional 6.3% |
| Immigrants | Ireland | 100.0 /100 | #25 | Exceptional 6.3% |
| Latvians | 100.0 /100 | #26 | Exceptional 6.2% |
Demographics Similar to Alaska Natives by Professional Degree
In terms of professional degree, the demographic groups most similar to Alaska Natives are Immigrants from Belize (3.5%, a difference of 0.070%), Chippewa (3.5%, a difference of 0.17%), Guatemalan (3.5%, a difference of 0.18%), Immigrants from Honduras (3.5%, a difference of 0.30%), and Blackfeet (3.5%, a difference of 0.36%).
| Demographics | Rating | Rank | Professional Degree |
| Salvadorans | 0.4 /100 | #284 | Tragic 3.5% |
| Hondurans | 0.3 /100 | #285 | Tragic 3.5% |
| Haitians | 0.3 /100 | #286 | Tragic 3.5% |
| Immigrants | El Salvador | 0.3 /100 | #287 | Tragic 3.5% |
| Blackfeet | 0.3 /100 | #288 | Tragic 3.5% |
| Guatemalans | 0.3 /100 | #289 | Tragic 3.5% |
| Chippewa | 0.3 /100 | #290 | Tragic 3.5% |
| Alaska Natives | 0.3 /100 | #291 | Tragic 3.5% |
| Immigrants | Belize | 0.3 /100 | #292 | Tragic 3.5% |
| Immigrants | Honduras | 0.3 /100 | #293 | Tragic 3.5% |
| Paiute | 0.3 /100 | #294 | Tragic 3.4% |
| Immigrants | Guatemala | 0.2 /100 | #295 | Tragic 3.4% |
| Hawaiians | 0.2 /100 | #296 | Tragic 3.4% |
| Immigrants | Liberia | 0.2 /100 | #297 | Tragic 3.4% |
| Ottawa | 0.2 /100 | #298 | Tragic 3.4% |