Immigrants vs Immigrants from Italy 2nd Grade
COMPARE
Immigrants
Immigrants from Italy
2nd Grade
2nd Grade Comparison
Immigrants
Immigrants from Italy
97.1%
2ND GRADE
0.0/ 100
METRIC RATING
296th/ 347
METRIC RANK
97.9%
2ND GRADE
60.2/ 100
METRIC RATING
162nd/ 347
METRIC RANK
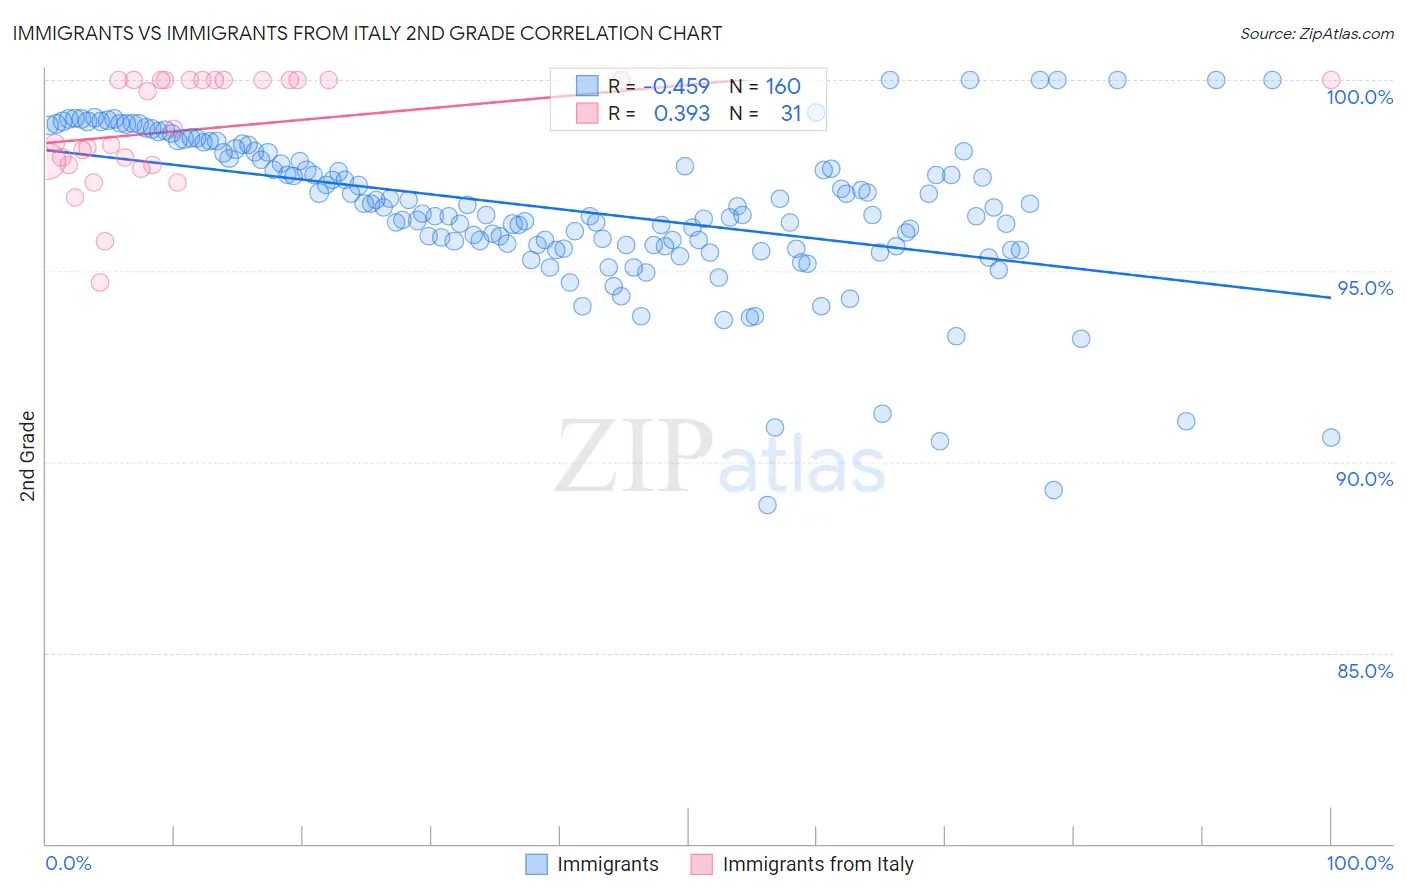
Immigrants vs Immigrants from Italy 2nd Grade Correlation Chart
The statistical analysis conducted on geographies consisting of 577,788,049 people shows a moderate negative correlation between the proportion of Immigrants and percentage of population with at least 2nd grade education in the United States with a correlation coefficient (R) of -0.459 and weighted average of 97.1%. Similarly, the statistical analysis conducted on geographies consisting of 324,225,917 people shows a mild positive correlation between the proportion of Immigrants from Italy and percentage of population with at least 2nd grade education in the United States with a correlation coefficient (R) of 0.393 and weighted average of 97.9%, a difference of 0.85%.
2nd Grade Correlation Summary
| Measurement | Immigrants | Immigrants from Italy |
| Minimum | 88.9% | 94.7% |
| Maximum | 100.0% | 100.0% |
| Range | 11.1% | 5.3% |
| Mean | 96.6% | 98.7% |
| Median | 96.6% | 98.7% |
| Interquartile 25% (IQ1) | 95.7% | 97.8% |
| Interquartile 75% (IQ3) | 98.1% | 100.0% |
| Interquartile Range (IQR) | 2.5% | 2.2% |
| Standard Deviation (Sample) | 2.0% | 1.4% |
| Standard Deviation (Population) | 2.0% | 1.4% |
Similar Demographics by 2nd Grade
Demographics Similar to Immigrants by 2nd Grade
In terms of 2nd grade, the demographic groups most similar to Immigrants are Immigrants from Grenada (97.1%, a difference of 0.040%), Malaysian (97.1%, a difference of 0.060%), Immigrants from Cuba (97.0%, a difference of 0.060%), Immigrants from Dominica (97.0%, a difference of 0.070%), and Haitian (97.0%, a difference of 0.070%).
| Demographics | Rating | Rank | 2nd Grade |
| Houma | 0.0 /100 | #289 | Tragic 97.2% |
| Immigrants | St. Vincent and the Grenadines | 0.0 /100 | #290 | Tragic 97.2% |
| Immigrants | Afghanistan | 0.0 /100 | #291 | Tragic 97.2% |
| Immigrants | Eritrea | 0.0 /100 | #292 | Tragic 97.2% |
| British West Indians | 0.0 /100 | #293 | Tragic 97.2% |
| Malaysians | 0.0 /100 | #294 | Tragic 97.1% |
| Immigrants | Grenada | 0.0 /100 | #295 | Tragic 97.1% |
| Immigrants | Immigrants | 0.0 /100 | #296 | Tragic 97.1% |
| Immigrants | Cuba | 0.0 /100 | #297 | Tragic 97.0% |
| Immigrants | Dominica | 0.0 /100 | #298 | Tragic 97.0% |
| Haitians | 0.0 /100 | #299 | Tragic 97.0% |
| Immigrants | South Eastern Asia | 0.0 /100 | #300 | Tragic 97.0% |
| Central American Indians | 0.0 /100 | #301 | Tragic 97.0% |
| Somalis | 0.0 /100 | #302 | Tragic 97.0% |
| Ecuadorians | 0.0 /100 | #303 | Tragic 96.9% |
Demographics Similar to Immigrants from Italy by 2nd Grade
In terms of 2nd grade, the demographic groups most similar to Immigrants from Italy are Immigrants from Eastern Europe (97.9%, a difference of 0.0%), Immigrants from Russia (97.9%, a difference of 0.0%), Bermudan (97.9%, a difference of 0.0%), French American Indian (97.9%, a difference of 0.010%), and Dutch West Indian (97.9%, a difference of 0.010%).
| Demographics | Rating | Rank | 2nd Grade |
| French American Indians | 64.3 /100 | #155 | Good 97.9% |
| Dutch West Indians | 63.8 /100 | #156 | Good 97.9% |
| Venezuelans | 63.3 /100 | #157 | Good 97.9% |
| Immigrants | Iran | 62.8 /100 | #158 | Good 97.9% |
| Comanche | 62.8 /100 | #159 | Good 97.9% |
| Immigrants | Eastern Europe | 61.1 /100 | #160 | Good 97.9% |
| Immigrants | Russia | 60.3 /100 | #161 | Good 97.9% |
| Immigrants | Italy | 60.2 /100 | #162 | Good 97.9% |
| Bermudans | 59.4 /100 | #163 | Average 97.9% |
| Ugandans | 56.6 /100 | #164 | Average 97.9% |
| Spanish Americans | 56.4 /100 | #165 | Average 97.9% |
| Immigrants | Jordan | 56.3 /100 | #166 | Average 97.9% |
| Chileans | 56.1 /100 | #167 | Average 97.9% |
| Brazilians | 55.8 /100 | #168 | Average 97.9% |
| Immigrants | Spain | 55.4 /100 | #169 | Average 97.9% |