Immigrants vs Cree Doctorate Degree
COMPARE
Immigrants
Cree
Doctorate Degree
Doctorate Degree Comparison
Immigrants
Cree
1.8%
DOCTORATE DEGREE
46.2/ 100
METRIC RATING
181st/ 347
METRIC RANK
1.6%
DOCTORATE DEGREE
3.0/ 100
METRIC RATING
235th/ 347
METRIC RANK
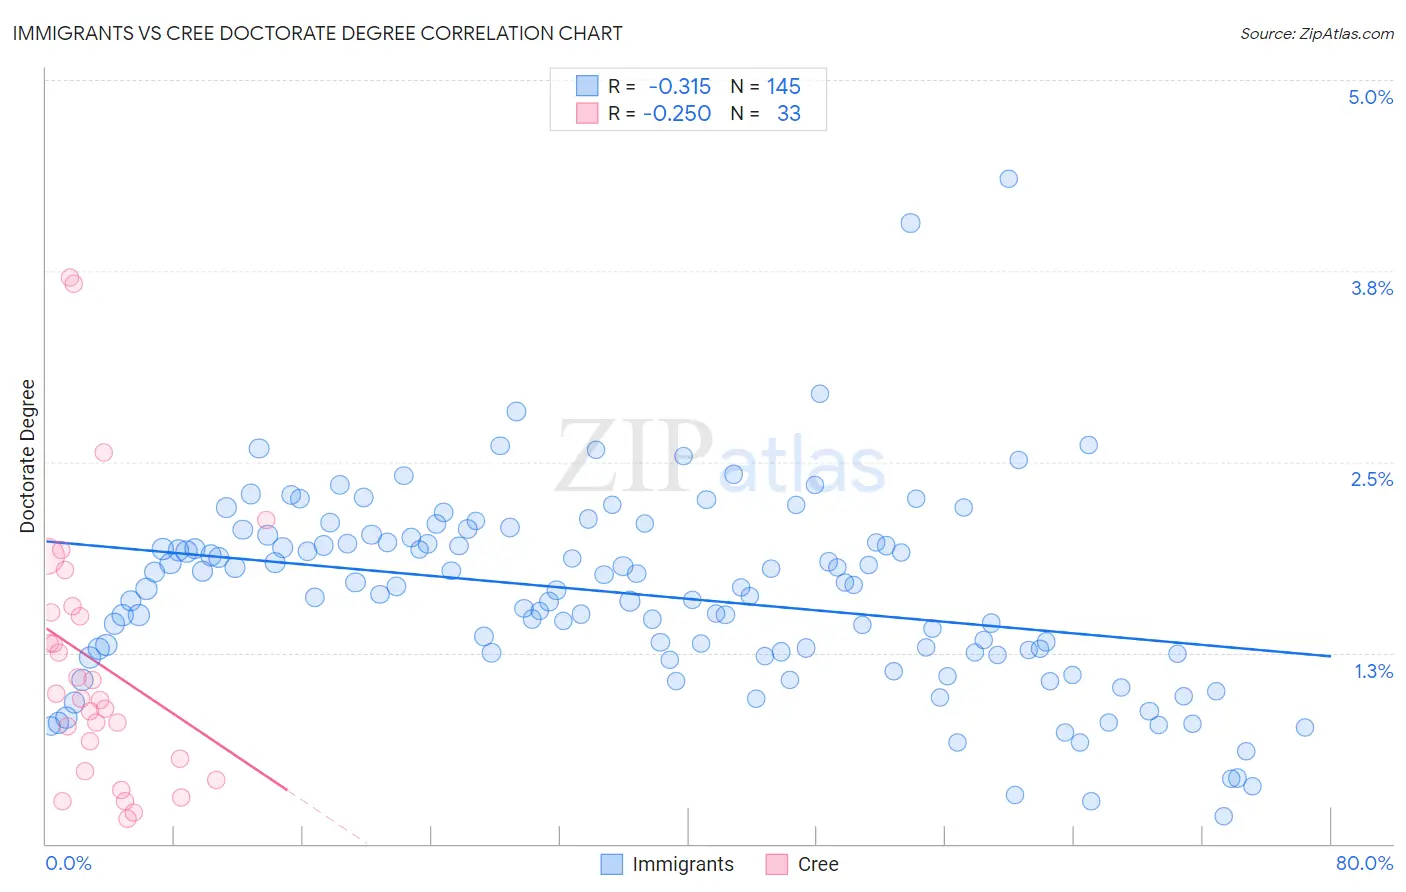
Immigrants vs Cree Doctorate Degree Correlation Chart
The statistical analysis conducted on geographies consisting of 551,358,177 people shows a mild negative correlation between the proportion of Immigrants and percentage of population with at least doctorate degree education in the United States with a correlation coefficient (R) of -0.315 and weighted average of 1.8%. Similarly, the statistical analysis conducted on geographies consisting of 75,903,599 people shows a weak negative correlation between the proportion of Cree and percentage of population with at least doctorate degree education in the United States with a correlation coefficient (R) of -0.250 and weighted average of 1.6%, a difference of 13.9%.
Doctorate Degree Correlation Summary
| Measurement | Immigrants | Cree |
| Minimum | 0.18% | 0.17% |
| Maximum | 4.4% | 3.7% |
| Range | 4.2% | 3.5% |
| Mean | 1.6% | 1.2% |
| Median | 1.7% | 0.95% |
| Interquartile 25% (IQ1) | 1.2% | 0.51% |
| Interquartile 75% (IQ3) | 2.0% | 1.5% |
| Interquartile Range (IQR) | 0.74% | 1.0% |
| Standard Deviation (Sample) | 0.64% | 0.88% |
| Standard Deviation (Population) | 0.64% | 0.87% |
Similar Demographics by Doctorate Degree
Demographics Similar to Immigrants by Doctorate Degree
In terms of doctorate degree, the demographic groups most similar to Immigrants are Scandinavian (1.8%, a difference of 0.26%), Immigrants from Afghanistan (1.8%, a difference of 0.29%), Ghanaian (1.8%, a difference of 0.31%), French (1.8%, a difference of 0.38%), and Iraqi (1.8%, a difference of 0.44%).
| Demographics | Rating | Rank | Doctorate Degree |
| Immigrants | Bangladesh | 50.0 /100 | #174 | Average 1.8% |
| Immigrants | Thailand | 49.4 /100 | #175 | Average 1.8% |
| Spanish | 49.3 /100 | #176 | Average 1.8% |
| Iraqis | 49.2 /100 | #177 | Average 1.8% |
| French | 48.8 /100 | #178 | Average 1.8% |
| Ghanaians | 48.3 /100 | #179 | Average 1.8% |
| Scandinavians | 48.0 /100 | #180 | Average 1.8% |
| Immigrants | Immigrants | 46.2 /100 | #181 | Average 1.8% |
| Immigrants | Afghanistan | 44.3 /100 | #182 | Average 1.8% |
| Finns | 42.1 /100 | #183 | Average 1.8% |
| Nigerians | 39.9 /100 | #184 | Fair 1.8% |
| Slovaks | 36.4 /100 | #185 | Fair 1.8% |
| Peruvians | 34.4 /100 | #186 | Fair 1.8% |
| Czechoslovakians | 33.0 /100 | #187 | Fair 1.8% |
| Germans | 30.5 /100 | #188 | Fair 1.8% |
Demographics Similar to Cree by Doctorate Degree
In terms of doctorate degree, the demographic groups most similar to Cree are Hopi (1.6%, a difference of 0.21%), Indonesian (1.6%, a difference of 0.29%), Barbadian (1.6%, a difference of 0.36%), Guamanian/Chamorro (1.6%, a difference of 0.43%), and Iroquois (1.6%, a difference of 0.47%).
| Demographics | Rating | Rank | Doctorate Degree |
| Assyrians/Chaldeans/Syriacs | 5.9 /100 | #228 | Tragic 1.7% |
| Colville | 4.7 /100 | #229 | Tragic 1.6% |
| Immigrants | Philippines | 4.3 /100 | #230 | Tragic 1.6% |
| Immigrants | North Macedonia | 3.9 /100 | #231 | Tragic 1.6% |
| Guamanians/Chamorros | 3.3 /100 | #232 | Tragic 1.6% |
| Barbadians | 3.3 /100 | #233 | Tragic 1.6% |
| Hopi | 3.2 /100 | #234 | Tragic 1.6% |
| Cree | 3.0 /100 | #235 | Tragic 1.6% |
| Indonesians | 2.8 /100 | #236 | Tragic 1.6% |
| Iroquois | 2.7 /100 | #237 | Tragic 1.6% |
| Immigrants | Congo | 2.6 /100 | #238 | Tragic 1.6% |
| West Indians | 2.5 /100 | #239 | Tragic 1.6% |
| Immigrants | Panama | 2.4 /100 | #240 | Tragic 1.6% |
| Cheyenne | 2.3 /100 | #241 | Tragic 1.6% |
| Ottawa | 2.2 /100 | #242 | Tragic 1.6% |