Immigrants from Zimbabwe vs Pennsylvania German Nursery School
COMPARE
Immigrants from Zimbabwe
Pennsylvania German
Nursery School
Nursery School Comparison
Immigrants from Zimbabwe
Pennsylvania Germans
98.2%
NURSERY SCHOOL
94.2/ 100
METRIC RATING
121st/ 347
METRIC RANK
98.6%
NURSERY SCHOOL
100.0/ 100
METRIC RATING
20th/ 347
METRIC RANK
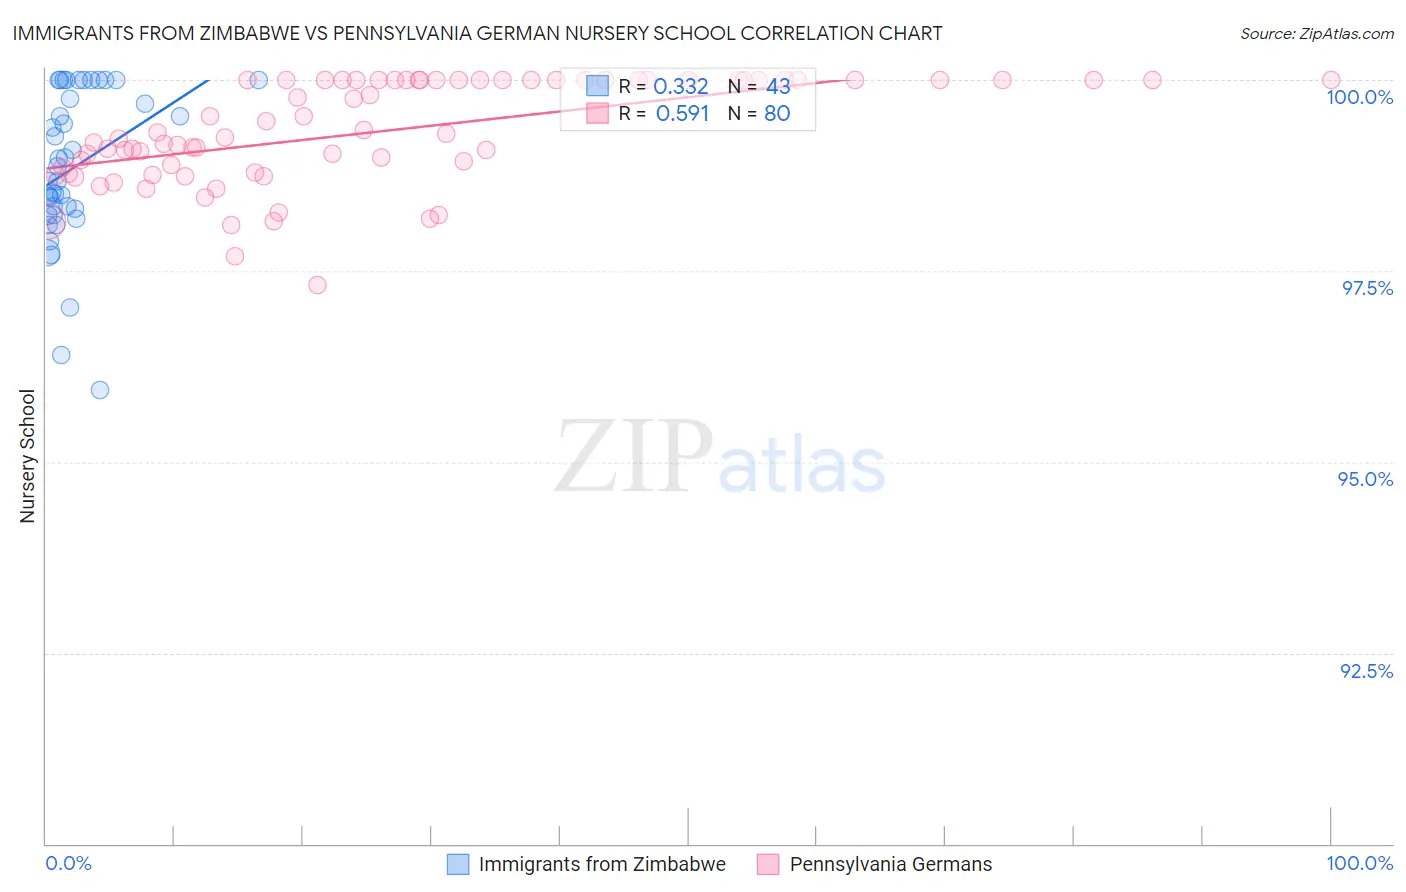
Immigrants from Zimbabwe vs Pennsylvania German Nursery School Correlation Chart
The statistical analysis conducted on geographies consisting of 117,756,150 people shows a mild positive correlation between the proportion of Immigrants from Zimbabwe and percentage of population with at least nursery school education in the United States with a correlation coefficient (R) of 0.332 and weighted average of 98.2%. Similarly, the statistical analysis conducted on geographies consisting of 234,102,531 people shows a substantial positive correlation between the proportion of Pennsylvania Germans and percentage of population with at least nursery school education in the United States with a correlation coefficient (R) of 0.591 and weighted average of 98.6%, a difference of 0.45%.
Nursery School Correlation Summary
| Measurement | Immigrants from Zimbabwe | Pennsylvania German |
| Minimum | 95.9% | 97.3% |
| Maximum | 100.0% | 100.0% |
| Range | 4.1% | 2.7% |
| Mean | 98.9% | 99.3% |
| Median | 98.9% | 99.3% |
| Interquartile 25% (IQ1) | 98.2% | 98.8% |
| Interquartile 75% (IQ3) | 100.0% | 100.0% |
| Interquartile Range (IQR) | 1.8% | 1.2% |
| Standard Deviation (Sample) | 1.0% | 0.68% |
| Standard Deviation (Population) | 1.00% | 0.67% |
Similar Demographics by Nursery School
Demographics Similar to Immigrants from Zimbabwe by Nursery School
In terms of nursery school, the demographic groups most similar to Immigrants from Zimbabwe are Okinawan (98.2%, a difference of 0.0%), Immigrants from Japan (98.2%, a difference of 0.0%), Syrian (98.2%, a difference of 0.0%), Thai (98.2%, a difference of 0.010%), and Lebanese (98.2%, a difference of 0.010%).
| Demographics | Rating | Rank | Nursery School |
| Ute | 96.4 /100 | #114 | Exceptional 98.2% |
| Iranians | 96.3 /100 | #115 | Exceptional 98.2% |
| Spanish | 95.8 /100 | #116 | Exceptional 98.2% |
| Immigrants | France | 95.6 /100 | #117 | Exceptional 98.2% |
| Yugoslavians | 95.4 /100 | #118 | Exceptional 98.2% |
| Thais | 95.0 /100 | #119 | Exceptional 98.2% |
| Okinawans | 94.5 /100 | #120 | Exceptional 98.2% |
| Immigrants | Zimbabwe | 94.2 /100 | #121 | Exceptional 98.2% |
| Immigrants | Japan | 94.0 /100 | #122 | Exceptional 98.2% |
| Syrians | 93.9 /100 | #123 | Exceptional 98.2% |
| Lebanese | 93.8 /100 | #124 | Exceptional 98.2% |
| Iroquois | 93.7 /100 | #125 | Exceptional 98.2% |
| Menominee | 93.6 /100 | #126 | Exceptional 98.2% |
| Immigrants | Saudi Arabia | 93.4 /100 | #127 | Exceptional 98.2% |
| Immigrants | Serbia | 92.4 /100 | #128 | Exceptional 98.2% |
Demographics Similar to Pennsylvania Germans by Nursery School
In terms of nursery school, the demographic groups most similar to Pennsylvania Germans are Finnish (98.6%, a difference of 0.0%), Lithuanian (98.6%, a difference of 0.0%), Polish (98.6%, a difference of 0.0%), Danish (98.6%, a difference of 0.0%), and Irish (98.6%, a difference of 0.010%).
| Demographics | Rating | Rank | Nursery School |
| English | 100.0 /100 | #13 | Exceptional 98.7% |
| Carpatho Rusyns | 100.0 /100 | #14 | Exceptional 98.7% |
| Swedes | 100.0 /100 | #15 | Exceptional 98.7% |
| Scottish | 100.0 /100 | #16 | Exceptional 98.7% |
| Aleuts | 100.0 /100 | #17 | Exceptional 98.7% |
| Dutch | 100.0 /100 | #18 | Exceptional 98.7% |
| Irish | 100.0 /100 | #19 | Exceptional 98.6% |
| Pennsylvania Germans | 100.0 /100 | #20 | Exceptional 98.6% |
| Finns | 100.0 /100 | #21 | Exceptional 98.6% |
| Lithuanians | 100.0 /100 | #22 | Exceptional 98.6% |
| Poles | 100.0 /100 | #23 | Exceptional 98.6% |
| Danes | 100.0 /100 | #24 | Exceptional 98.6% |
| Scotch-Irish | 100.0 /100 | #25 | Exceptional 98.6% |
| Sioux | 100.0 /100 | #26 | Exceptional 98.6% |
| Arapaho | 100.0 /100 | #27 | Exceptional 98.6% |