Immigrants from Zaire vs Immigrants from Saudi Arabia 4th Grade
COMPARE
Immigrants from Zaire
Immigrants from Saudi Arabia
4th Grade
4th Grade Comparison
Immigrants from Zaire
Immigrants from Saudi Arabia
97.3%
4TH GRADE
12.8/ 100
METRIC RATING
206th/ 347
METRIC RANK
97.8%
4TH GRADE
94.8/ 100
METRIC RATING
119th/ 347
METRIC RANK
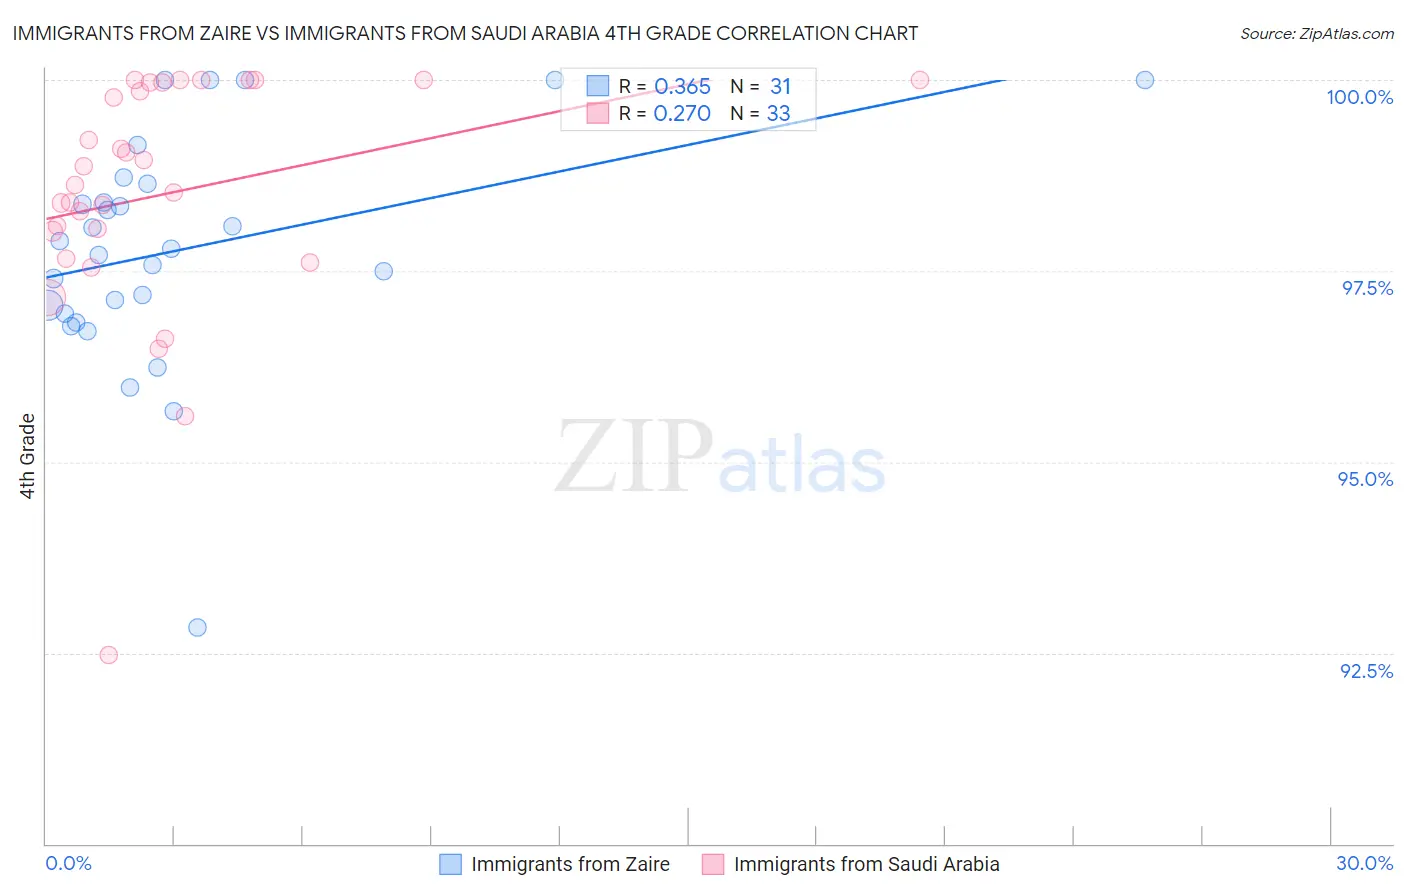
Immigrants from Zaire vs Immigrants from Saudi Arabia 4th Grade Correlation Chart
The statistical analysis conducted on geographies consisting of 107,212,695 people shows a mild positive correlation between the proportion of Immigrants from Zaire and percentage of population with at least 4th grade education in the United States with a correlation coefficient (R) of 0.365 and weighted average of 97.3%. Similarly, the statistical analysis conducted on geographies consisting of 164,277,573 people shows a weak positive correlation between the proportion of Immigrants from Saudi Arabia and percentage of population with at least 4th grade education in the United States with a correlation coefficient (R) of 0.270 and weighted average of 97.8%, a difference of 0.46%.
4th Grade Correlation Summary
| Measurement | Immigrants from Zaire | Immigrants from Saudi Arabia |
| Minimum | 92.8% | 92.5% |
| Maximum | 100.0% | 100.0% |
| Range | 7.2% | 7.5% |
| Mean | 97.8% | 98.5% |
| Median | 97.8% | 98.6% |
| Interquartile 25% (IQ1) | 96.9% | 97.8% |
| Interquartile 75% (IQ3) | 98.6% | 100.0% |
| Interquartile Range (IQR) | 1.7% | 2.1% |
| Standard Deviation (Sample) | 1.5% | 1.6% |
| Standard Deviation (Population) | 1.5% | 1.6% |
Similar Demographics by 4th Grade
Demographics Similar to Immigrants from Zaire by 4th Grade
In terms of 4th grade, the demographic groups most similar to Immigrants from Zaire are Paiute (97.3%, a difference of 0.0%), African (97.4%, a difference of 0.010%), Moroccan (97.3%, a difference of 0.010%), Immigrants from Northern Africa (97.4%, a difference of 0.020%), and Immigrants from Bahamas (97.3%, a difference of 0.020%).
| Demographics | Rating | Rank | 4th Grade |
| Natives/Alaskans | 20.6 /100 | #199 | Fair 97.4% |
| Immigrants | Uganda | 19.8 /100 | #200 | Poor 97.4% |
| Immigrants | Southern Europe | 16.2 /100 | #201 | Poor 97.4% |
| Immigrants | Chile | 16.1 /100 | #202 | Poor 97.4% |
| Immigrants | Northern Africa | 15.1 /100 | #203 | Poor 97.4% |
| Africans | 14.6 /100 | #204 | Poor 97.4% |
| Paiute | 13.2 /100 | #205 | Poor 97.3% |
| Immigrants | Zaire | 12.8 /100 | #206 | Poor 97.3% |
| Moroccans | 11.3 /100 | #207 | Poor 97.3% |
| Immigrants | Bahamas | 10.8 /100 | #208 | Poor 97.3% |
| Laotians | 9.3 /100 | #209 | Tragic 97.3% |
| Immigrants | Oceania | 9.1 /100 | #210 | Tragic 97.3% |
| Sudanese | 9.0 /100 | #211 | Tragic 97.3% |
| Tohono O'odham | 8.4 /100 | #212 | Tragic 97.3% |
| Costa Ricans | 8.3 /100 | #213 | Tragic 97.3% |
Demographics Similar to Immigrants from Saudi Arabia by 4th Grade
In terms of 4th grade, the demographic groups most similar to Immigrants from Saudi Arabia are Syrian (97.8%, a difference of 0.0%), Menominee (97.8%, a difference of 0.0%), Immigrants from France (97.8%, a difference of 0.0%), Iroquois (97.8%, a difference of 0.010%), and Lebanese (97.8%, a difference of 0.010%).
| Demographics | Rating | Rank | 4th Grade |
| Okinawans | 96.0 /100 | #112 | Exceptional 97.8% |
| Basques | 95.8 /100 | #113 | Exceptional 97.8% |
| Iroquois | 95.4 /100 | #114 | Exceptional 97.8% |
| Lebanese | 95.4 /100 | #115 | Exceptional 97.8% |
| Immigrants | Croatia | 95.2 /100 | #116 | Exceptional 97.8% |
| Syrians | 94.9 /100 | #117 | Exceptional 97.8% |
| Menominee | 94.9 /100 | #118 | Exceptional 97.8% |
| Immigrants | Saudi Arabia | 94.8 /100 | #119 | Exceptional 97.8% |
| Immigrants | France | 94.8 /100 | #120 | Exceptional 97.8% |
| Immigrants | Norway | 94.2 /100 | #121 | Exceptional 97.8% |
| Immigrants | Japan | 94.1 /100 | #122 | Exceptional 97.8% |
| Immigrants | Zimbabwe | 93.9 /100 | #123 | Exceptional 97.8% |
| Spanish | 93.7 /100 | #124 | Exceptional 97.8% |
| Immigrants | Serbia | 92.6 /100 | #125 | Exceptional 97.8% |
| Immigrants | Europe | 92.5 /100 | #126 | Exceptional 97.8% |