Immigrants from Zaire vs Immigrants from Colombia Master's Degree
COMPARE
Immigrants from Zaire
Immigrants from Colombia
Master's Degree
Master's Degree Comparison
Immigrants from Zaire
Immigrants from Colombia
14.7%
MASTER'S DEGREE
39.5/ 100
METRIC RATING
184th/ 347
METRIC RANK
14.9%
MASTER'S DEGREE
48.3/ 100
METRIC RATING
177th/ 347
METRIC RANK
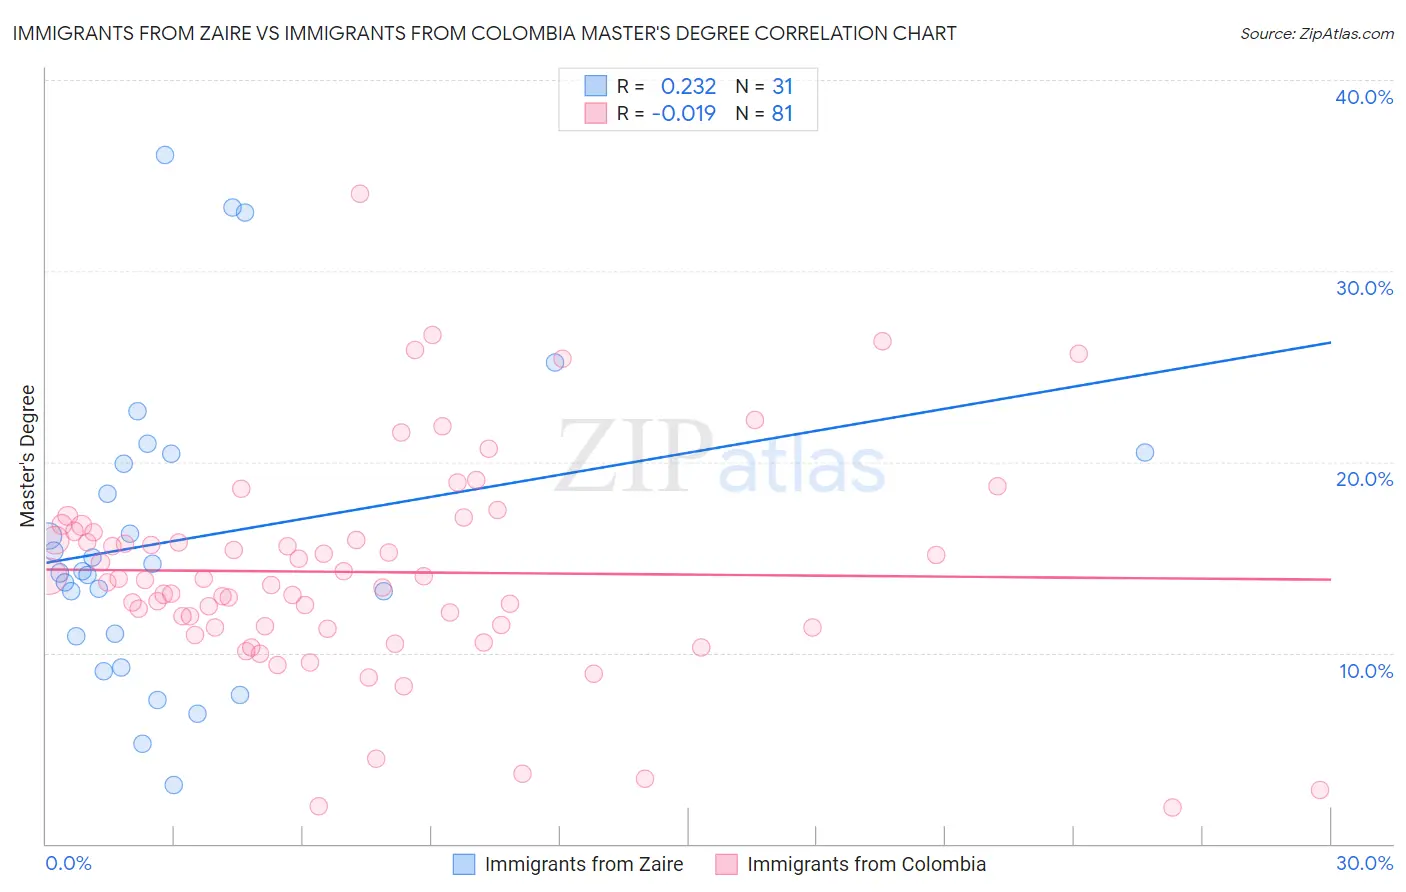
Immigrants from Zaire vs Immigrants from Colombia Master's Degree Correlation Chart
The statistical analysis conducted on geographies consisting of 107,246,977 people shows a weak positive correlation between the proportion of Immigrants from Zaire and percentage of population with at least master's degree education in the United States with a correlation coefficient (R) of 0.232 and weighted average of 14.7%. Similarly, the statistical analysis conducted on geographies consisting of 378,578,411 people shows no correlation between the proportion of Immigrants from Colombia and percentage of population with at least master's degree education in the United States with a correlation coefficient (R) of -0.019 and weighted average of 14.9%, a difference of 1.2%.
Master's Degree Correlation Summary
| Measurement | Immigrants from Zaire | Immigrants from Colombia |
| Minimum | 3.1% | 1.9% |
| Maximum | 36.1% | 34.0% |
| Range | 33.0% | 32.1% |
| Mean | 15.9% | 14.2% |
| Median | 14.3% | 13.8% |
| Interquartile 25% (IQ1) | 10.9% | 11.3% |
| Interquartile 75% (IQ3) | 20.4% | 16.3% |
| Interquartile Range (IQR) | 9.6% | 5.0% |
| Standard Deviation (Sample) | 8.0% | 5.6% |
| Standard Deviation (Population) | 7.8% | 5.6% |
Demographics Similar to Immigrants from Zaire and Immigrants from Colombia by Master's Degree
In terms of master's degree, the demographic groups most similar to Immigrants from Zaire are Sri Lankan (14.7%, a difference of 0.020%), Czech (14.7%, a difference of 0.12%), Barbadian (14.7%, a difference of 0.16%), Swiss (14.7%, a difference of 0.22%), and Immigrants from Iraq (14.8%, a difference of 0.25%). Similarly, the demographic groups most similar to Immigrants from Colombia are Nigerian (14.9%, a difference of 0.030%), Immigrants from Peru (14.9%, a difference of 0.17%), Slovak (14.9%, a difference of 0.21%), English (14.8%, a difference of 0.44%), and Costa Rican (15.0%, a difference of 0.53%).
| Demographics | Rating | Rank | Master's Degree |
| Irish | 56.3 /100 | #170 | Average 15.0% |
| Immigrants | Ghana | 53.6 /100 | #171 | Average 15.0% |
| Immigrants | Uruguay | 52.8 /100 | #172 | Average 15.0% |
| Costa Ricans | 52.5 /100 | #173 | Average 15.0% |
| Slovaks | 50.0 /100 | #174 | Average 14.9% |
| Immigrants | Peru | 49.6 /100 | #175 | Average 14.9% |
| Nigerians | 48.6 /100 | #176 | Average 14.9% |
| Immigrants | Colombia | 48.3 /100 | #177 | Average 14.9% |
| English | 45.0 /100 | #178 | Average 14.8% |
| Immigrants | Iraq | 41.3 /100 | #179 | Average 14.8% |
| Celtics | 41.3 /100 | #180 | Average 14.8% |
| Swiss | 41.1 /100 | #181 | Average 14.7% |
| Czechs | 40.4 /100 | #182 | Average 14.7% |
| Sri Lankans | 39.6 /100 | #183 | Fair 14.7% |
| Immigrants | Zaire | 39.5 /100 | #184 | Fair 14.7% |
| Barbadians | 38.3 /100 | #185 | Fair 14.7% |
| Immigrants | Oceania | 37.1 /100 | #186 | Fair 14.7% |
| Basques | 36.5 /100 | #187 | Fair 14.7% |
| Immigrants | Costa Rica | 36.2 /100 | #188 | Fair 14.7% |
| Immigrants | Immigrants | 36.0 /100 | #189 | Fair 14.6% |
| Spaniards | 35.8 /100 | #190 | Fair 14.6% |