Immigrants from Zaire vs Immigrants from Cabo Verde Doctorate Degree
COMPARE
Immigrants from Zaire
Immigrants from Cabo Verde
Doctorate Degree
Doctorate Degree Comparison
Immigrants from Zaire
Immigrants from Cabo Verde
2.0%
DOCTORATE DEGREE
91.1/ 100
METRIC RATING
128th/ 347
METRIC RANK
1.3%
DOCTORATE DEGREE
0.0/ 100
METRIC RATING
326th/ 347
METRIC RANK
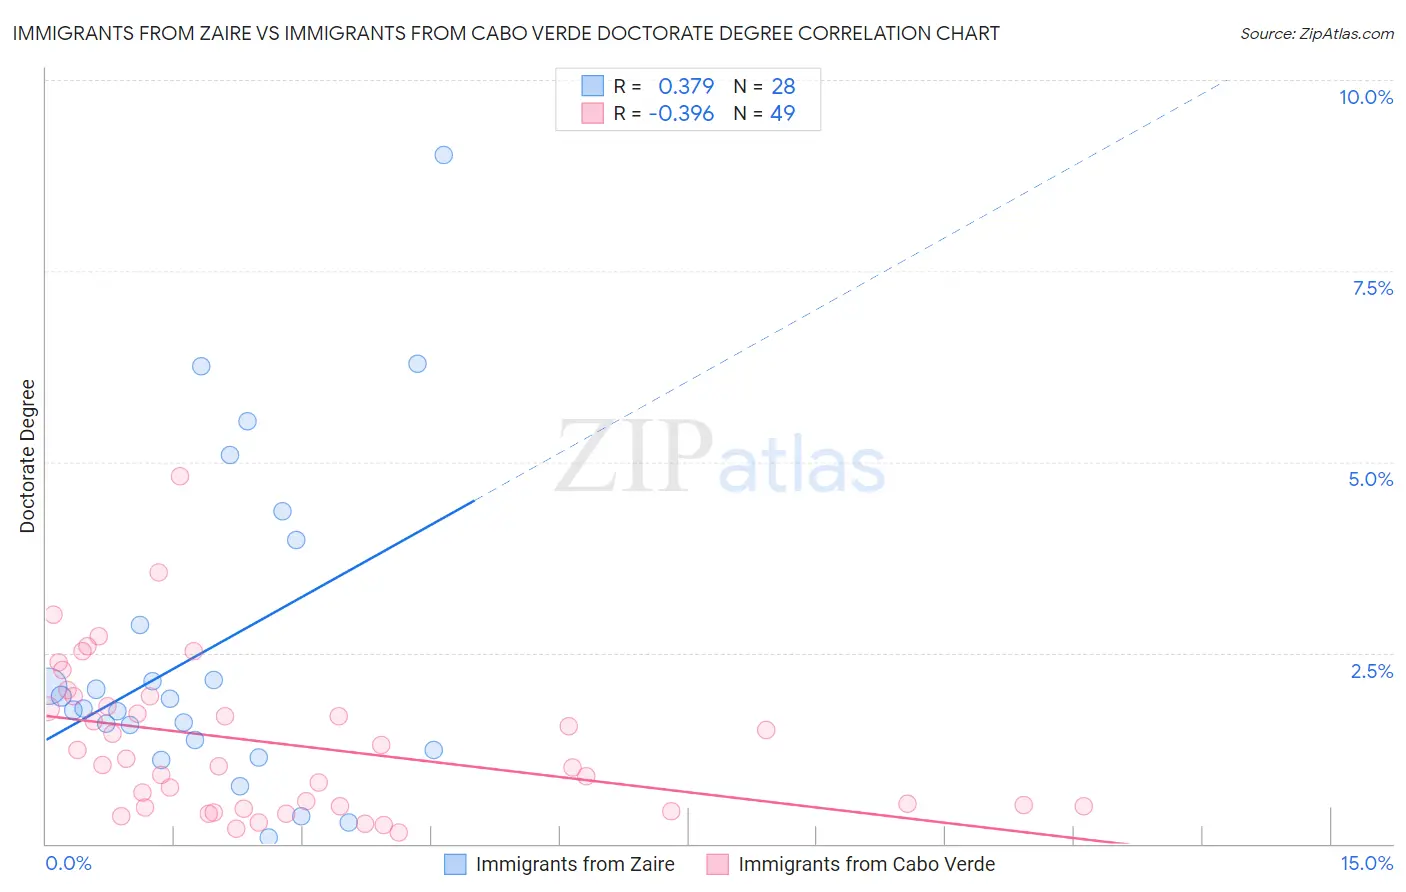
Immigrants from Zaire vs Immigrants from Cabo Verde Doctorate Degree Correlation Chart
The statistical analysis conducted on geographies consisting of 107,152,130 people shows a mild positive correlation between the proportion of Immigrants from Zaire and percentage of population with at least doctorate degree education in the United States with a correlation coefficient (R) of 0.379 and weighted average of 2.0%. Similarly, the statistical analysis conducted on geographies consisting of 38,072,290 people shows a mild negative correlation between the proportion of Immigrants from Cabo Verde and percentage of population with at least doctorate degree education in the United States with a correlation coefficient (R) of -0.396 and weighted average of 1.3%, a difference of 51.3%.
Doctorate Degree Correlation Summary
| Measurement | Immigrants from Zaire | Immigrants from Cabo Verde |
| Minimum | 0.076% | 0.14% |
| Maximum | 9.0% | 4.8% |
| Range | 8.9% | 4.7% |
| Mean | 2.6% | 1.3% |
| Median | 1.8% | 1.0% |
| Interquartile 25% (IQ1) | 1.3% | 0.49% |
| Interquartile 75% (IQ3) | 3.4% | 1.9% |
| Interquartile Range (IQR) | 2.1% | 1.4% |
| Standard Deviation (Sample) | 2.1% | 0.99% |
| Standard Deviation (Population) | 2.1% | 0.98% |
Similar Demographics by Doctorate Degree
Demographics Similar to Immigrants from Zaire by Doctorate Degree
In terms of doctorate degree, the demographic groups most similar to Immigrants from Zaire are Canadian (2.0%, a difference of 0.22%), Immigrants from Ukraine (2.0%, a difference of 0.22%), Immigrants from Sierra Leone (2.0%, a difference of 0.36%), Palestinian (2.0%, a difference of 0.42%), and Jordanian (2.0%, a difference of 0.46%).
| Demographics | Rating | Rank | Doctorate Degree |
| Immigrants | Jordan | 94.8 /100 | #121 | Exceptional 2.0% |
| Immigrants | Southern Europe | 94.7 /100 | #122 | Exceptional 2.0% |
| Croatians | 94.0 /100 | #123 | Exceptional 2.0% |
| Ute | 93.2 /100 | #124 | Exceptional 2.0% |
| Moroccans | 93.0 /100 | #125 | Exceptional 2.0% |
| Jordanians | 92.1 /100 | #126 | Exceptional 2.0% |
| Palestinians | 92.0 /100 | #127 | Exceptional 2.0% |
| Immigrants | Zaire | 91.1 /100 | #128 | Exceptional 2.0% |
| Canadians | 90.6 /100 | #129 | Exceptional 2.0% |
| Immigrants | Ukraine | 90.5 /100 | #130 | Exceptional 2.0% |
| Immigrants | Sierra Leone | 90.2 /100 | #131 | Exceptional 2.0% |
| Scottish | 89.4 /100 | #132 | Excellent 2.0% |
| Immigrants | Uzbekistan | 89.3 /100 | #133 | Excellent 2.0% |
| Immigrants | Cameroon | 88.9 /100 | #134 | Excellent 2.0% |
| Serbians | 88.7 /100 | #135 | Excellent 2.0% |
Demographics Similar to Immigrants from Cabo Verde by Doctorate Degree
In terms of doctorate degree, the demographic groups most similar to Immigrants from Cabo Verde are Pima (1.3%, a difference of 0.020%), Hispanic or Latino (1.3%, a difference of 0.29%), Native/Alaskan (1.3%, a difference of 0.41%), Immigrants from Belize (1.3%, a difference of 0.74%), and Inupiat (1.3%, a difference of 0.87%).
| Demographics | Rating | Rank | Doctorate Degree |
| Immigrants | Guyana | 0.1 /100 | #319 | Tragic 1.3% |
| Immigrants | St. Vincent and the Grenadines | 0.1 /100 | #320 | Tragic 1.3% |
| Dutch West Indians | 0.1 /100 | #321 | Tragic 1.3% |
| Seminole | 0.1 /100 | #322 | Tragic 1.3% |
| Immigrants | Belize | 0.1 /100 | #323 | Tragic 1.3% |
| Natives/Alaskans | 0.0 /100 | #324 | Tragic 1.3% |
| Pima | 0.0 /100 | #325 | Tragic 1.3% |
| Immigrants | Cabo Verde | 0.0 /100 | #326 | Tragic 1.3% |
| Hispanics or Latinos | 0.0 /100 | #327 | Tragic 1.3% |
| Inupiat | 0.0 /100 | #328 | Tragic 1.3% |
| Haitians | 0.0 /100 | #329 | Tragic 1.3% |
| Yup'ik | 0.0 /100 | #330 | Tragic 1.3% |
| Immigrants | Latin America | 0.0 /100 | #331 | Tragic 1.3% |
| Yakama | 0.0 /100 | #332 | Tragic 1.3% |
| Immigrants | Caribbean | 0.0 /100 | #333 | Tragic 1.3% |