Immigrants from Yemen vs Cajun Doctorate Degree
COMPARE
Immigrants from Yemen
Cajun
Doctorate Degree
Doctorate Degree Comparison
Immigrants from Yemen
Cajuns
1.4%
DOCTORATE DEGREE
0.2/ 100
METRIC RATING
293rd/ 347
METRIC RANK
1.5%
DOCTORATE DEGREE
0.3/ 100
METRIC RATING
287th/ 347
METRIC RANK
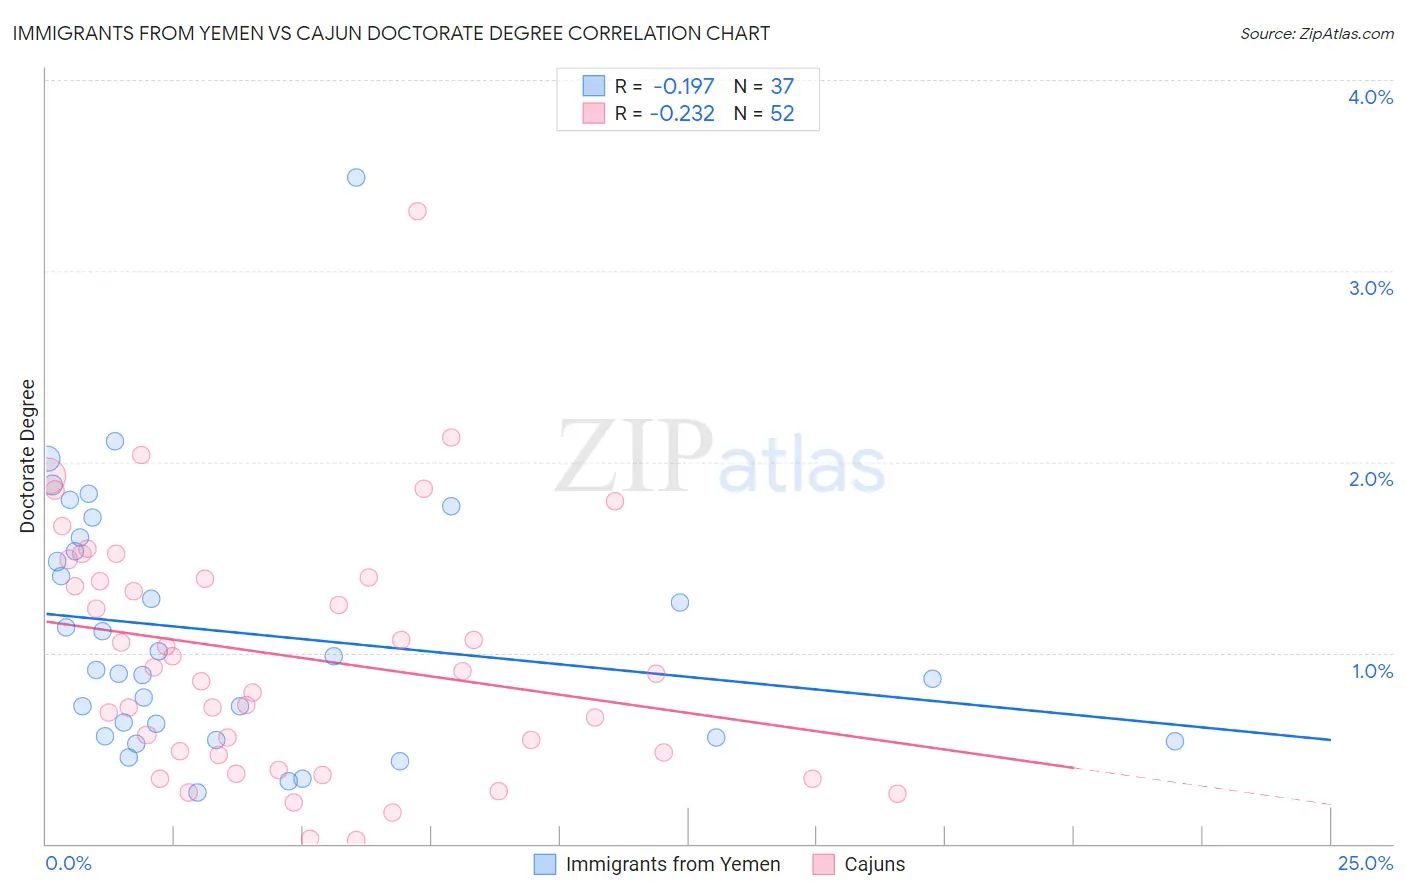
Immigrants from Yemen vs Cajun Doctorate Degree Correlation Chart
The statistical analysis conducted on geographies consisting of 82,189,372 people shows a poor negative correlation between the proportion of Immigrants from Yemen and percentage of population with at least doctorate degree education in the United States with a correlation coefficient (R) of -0.197 and weighted average of 1.4%. Similarly, the statistical analysis conducted on geographies consisting of 148,318,310 people shows a weak negative correlation between the proportion of Cajuns and percentage of population with at least doctorate degree education in the United States with a correlation coefficient (R) of -0.232 and weighted average of 1.5%, a difference of 1.3%.
Doctorate Degree Correlation Summary
| Measurement | Immigrants from Yemen | Cajun |
| Minimum | 0.27% | 0.021% |
| Maximum | 3.5% | 3.3% |
| Range | 3.2% | 3.3% |
| Mean | 1.1% | 0.98% |
| Median | 0.91% | 0.90% |
| Interquartile 25% (IQ1) | 0.56% | 0.47% |
| Interquartile 75% (IQ3) | 1.6% | 1.4% |
| Interquartile Range (IQR) | 1.0% | 0.92% |
| Standard Deviation (Sample) | 0.67% | 0.65% |
| Standard Deviation (Population) | 0.66% | 0.65% |
Demographics Similar to Immigrants from Yemen and Cajuns by Doctorate Degree
In terms of doctorate degree, the demographic groups most similar to Immigrants from Yemen are Alaska Native (1.4%, a difference of 0.59%), Samoan (1.4%, a difference of 0.71%), Black/African American (1.4%, a difference of 0.76%), Choctaw (1.4%, a difference of 0.99%), and Cape Verdean (1.4%, a difference of 1.0%). Similarly, the demographic groups most similar to Cajuns are Cherokee (1.5%, a difference of 0.17%), Immigrants from El Salvador (1.4%, a difference of 0.18%), Cape Verdean (1.4%, a difference of 0.31%), Choctaw (1.4%, a difference of 0.33%), and Malaysian (1.5%, a difference of 0.34%).
| Demographics | Rating | Rank | Doctorate Degree |
| Ecuadorians | 0.4 /100 | #280 | Tragic 1.5% |
| Tohono O'odham | 0.4 /100 | #281 | Tragic 1.5% |
| British West Indians | 0.3 /100 | #282 | Tragic 1.5% |
| Central Americans | 0.3 /100 | #283 | Tragic 1.5% |
| Jamaicans | 0.3 /100 | #284 | Tragic 1.5% |
| Malaysians | 0.3 /100 | #285 | Tragic 1.5% |
| Cherokee | 0.3 /100 | #286 | Tragic 1.5% |
| Cajuns | 0.3 /100 | #287 | Tragic 1.5% |
| Immigrants | El Salvador | 0.3 /100 | #288 | Tragic 1.4% |
| Cape Verdeans | 0.3 /100 | #289 | Tragic 1.4% |
| Choctaw | 0.3 /100 | #290 | Tragic 1.4% |
| Blacks/African Americans | 0.3 /100 | #291 | Tragic 1.4% |
| Alaska Natives | 0.3 /100 | #292 | Tragic 1.4% |
| Immigrants | Yemen | 0.2 /100 | #293 | Tragic 1.4% |
| Samoans | 0.2 /100 | #294 | Tragic 1.4% |
| Guatemalans | 0.2 /100 | #295 | Tragic 1.4% |
| Immigrants | Ecuador | 0.2 /100 | #296 | Tragic 1.4% |
| Tsimshian | 0.2 /100 | #297 | Tragic 1.4% |
| Puerto Ricans | 0.1 /100 | #298 | Tragic 1.4% |
| Belizeans | 0.1 /100 | #299 | Tragic 1.4% |
| Immigrants | Guatemala | 0.1 /100 | #300 | Tragic 1.4% |