Immigrants from Western Europe vs South American 5th Grade
COMPARE
Immigrants from Western Europe
South American
5th Grade
5th Grade Comparison
Immigrants from Western Europe
South Americans
97.8%
5TH GRADE
98.8/ 100
METRIC RATING
91st/ 347
METRIC RANK
96.8%
5TH GRADE
0.7/ 100
METRIC RATING
255th/ 347
METRIC RANK
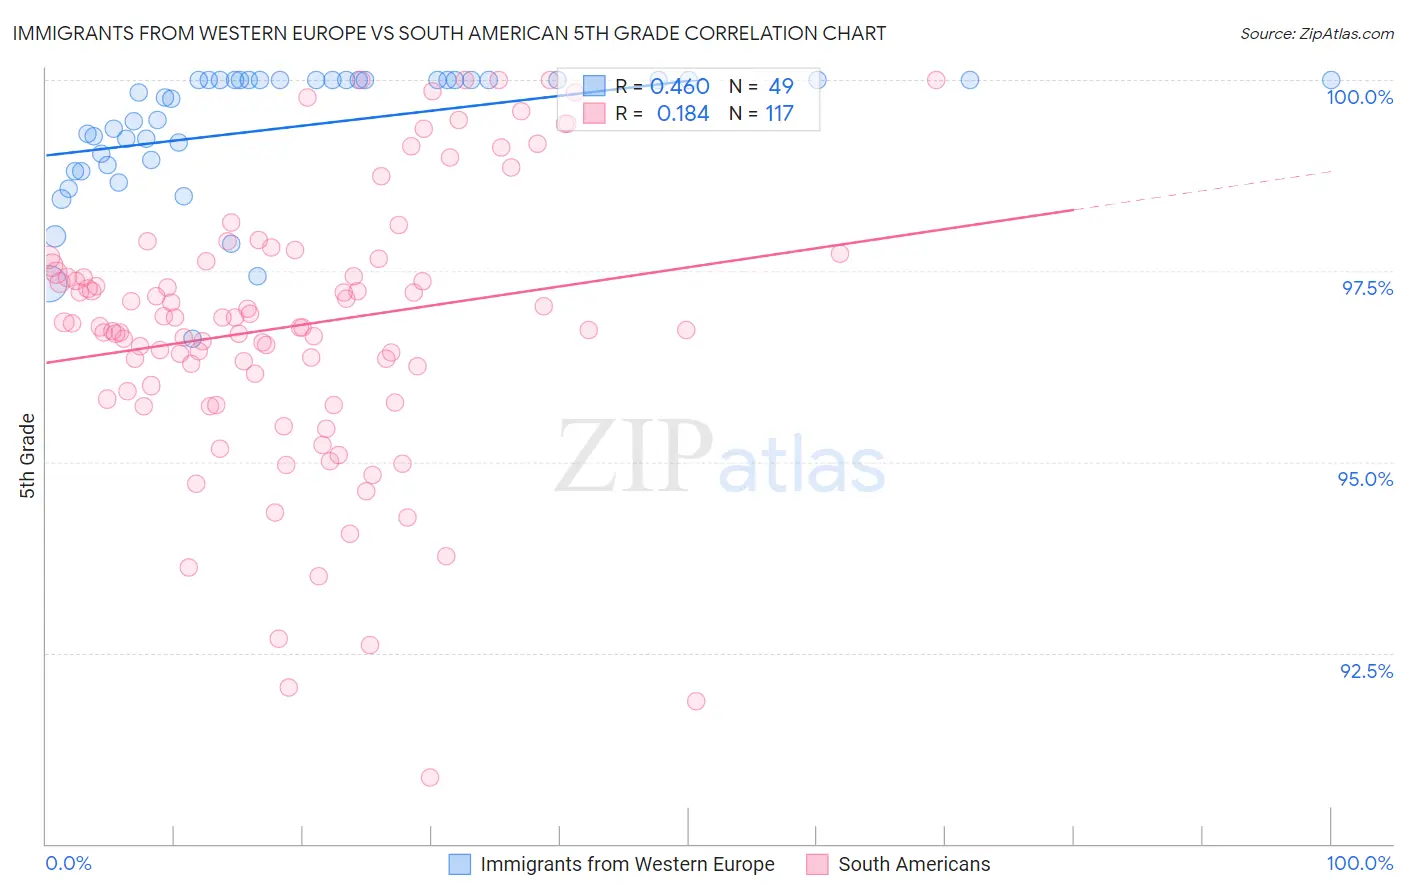
Immigrants from Western Europe vs South American 5th Grade Correlation Chart
The statistical analysis conducted on geographies consisting of 494,080,297 people shows a moderate positive correlation between the proportion of Immigrants from Western Europe and percentage of population with at least 5th grade education in the United States with a correlation coefficient (R) of 0.460 and weighted average of 97.8%. Similarly, the statistical analysis conducted on geographies consisting of 494,178,447 people shows a poor positive correlation between the proportion of South Americans and percentage of population with at least 5th grade education in the United States with a correlation coefficient (R) of 0.184 and weighted average of 96.8%, a difference of 0.98%.
5th Grade Correlation Summary
| Measurement | Immigrants from Western Europe | South American |
| Minimum | 96.6% | 90.9% |
| Maximum | 100.0% | 100.0% |
| Range | 3.4% | 9.1% |
| Mean | 99.4% | 96.8% |
| Median | 99.8% | 96.8% |
| Interquartile 25% (IQ1) | 98.9% | 96.0% |
| Interquartile 75% (IQ3) | 100.0% | 97.6% |
| Interquartile Range (IQR) | 1.1% | 1.7% |
| Standard Deviation (Sample) | 0.84% | 1.8% |
| Standard Deviation (Population) | 0.83% | 1.8% |
Similar Demographics by 5th Grade
Demographics Similar to Immigrants from Western Europe by 5th Grade
In terms of 5th grade, the demographic groups most similar to Immigrants from Western Europe are Immigrants from South Africa (97.8%, a difference of 0.0%), Immigrants from Ireland (97.8%, a difference of 0.0%), Immigrants from Sweden (97.8%, a difference of 0.0%), Cypriot (97.8%, a difference of 0.010%), and Immigrants from Australia (97.8%, a difference of 0.010%).
| Demographics | Rating | Rank | 5th Grade |
| Potawatomi | 99.0 /100 | #84 | Exceptional 97.8% |
| Immigrants | Belgium | 99.0 /100 | #85 | Exceptional 97.8% |
| Cypriots | 98.9 /100 | #86 | Exceptional 97.8% |
| Immigrants | Australia | 98.8 /100 | #87 | Exceptional 97.8% |
| Shoshone | 98.8 /100 | #88 | Exceptional 97.8% |
| Immigrants | South Africa | 98.8 /100 | #89 | Exceptional 97.8% |
| Immigrants | Ireland | 98.8 /100 | #90 | Exceptional 97.8% |
| Immigrants | Western Europe | 98.8 /100 | #91 | Exceptional 97.8% |
| Immigrants | Sweden | 98.7 /100 | #92 | Exceptional 97.8% |
| Delaware | 98.6 /100 | #93 | Exceptional 97.8% |
| Immigrants | Denmark | 98.6 /100 | #94 | Exceptional 97.8% |
| Romanians | 98.6 /100 | #95 | Exceptional 97.8% |
| Immigrants | Germany | 98.5 /100 | #96 | Exceptional 97.8% |
| Cree | 98.4 /100 | #97 | Exceptional 97.7% |
| Yugoslavians | 98.3 /100 | #98 | Exceptional 97.7% |
Demographics Similar to South Americans by 5th Grade
In terms of 5th grade, the demographic groups most similar to South Americans are Immigrants from Congo (96.8%, a difference of 0.0%), Peruvian (96.8%, a difference of 0.010%), Immigrants from Middle Africa (96.8%, a difference of 0.020%), Immigrants from Senegal (96.8%, a difference of 0.020%), and Jamaican (96.9%, a difference of 0.030%).
| Demographics | Rating | Rank | 5th Grade |
| U.S. Virgin Islanders | 1.1 /100 | #248 | Tragic 96.9% |
| Immigrants | Uruguay | 1.0 /100 | #249 | Tragic 96.9% |
| Immigrants | Liberia | 1.0 /100 | #250 | Tragic 96.9% |
| Bolivians | 0.9 /100 | #251 | Tragic 96.9% |
| Jamaicans | 0.9 /100 | #252 | Tragic 96.9% |
| Immigrants | Middle Africa | 0.8 /100 | #253 | Tragic 96.8% |
| Immigrants | Senegal | 0.8 /100 | #254 | Tragic 96.8% |
| South Americans | 0.7 /100 | #255 | Tragic 96.8% |
| Immigrants | Congo | 0.7 /100 | #256 | Tragic 96.8% |
| Peruvians | 0.6 /100 | #257 | Tragic 96.8% |
| Immigrants | Ethiopia | 0.5 /100 | #258 | Tragic 96.8% |
| Immigrants | China | 0.5 /100 | #259 | Tragic 96.8% |
| Immigrants | Jamaica | 0.4 /100 | #260 | Tragic 96.8% |
| Immigrants | Sierra Leone | 0.4 /100 | #261 | Tragic 96.8% |
| Immigrants | Colombia | 0.4 /100 | #262 | Tragic 96.8% |