Immigrants from Western Europe vs Immigrants from Nepal 6th Grade
COMPARE
Immigrants from Western Europe
Immigrants from Nepal
6th Grade
6th Grade Comparison
Immigrants from Western Europe
Immigrants from Nepal
97.5%
6TH GRADE
98.8/ 100
METRIC RATING
91st/ 347
METRIC RANK
96.8%
6TH GRADE
10.1/ 100
METRIC RATING
210th/ 347
METRIC RANK
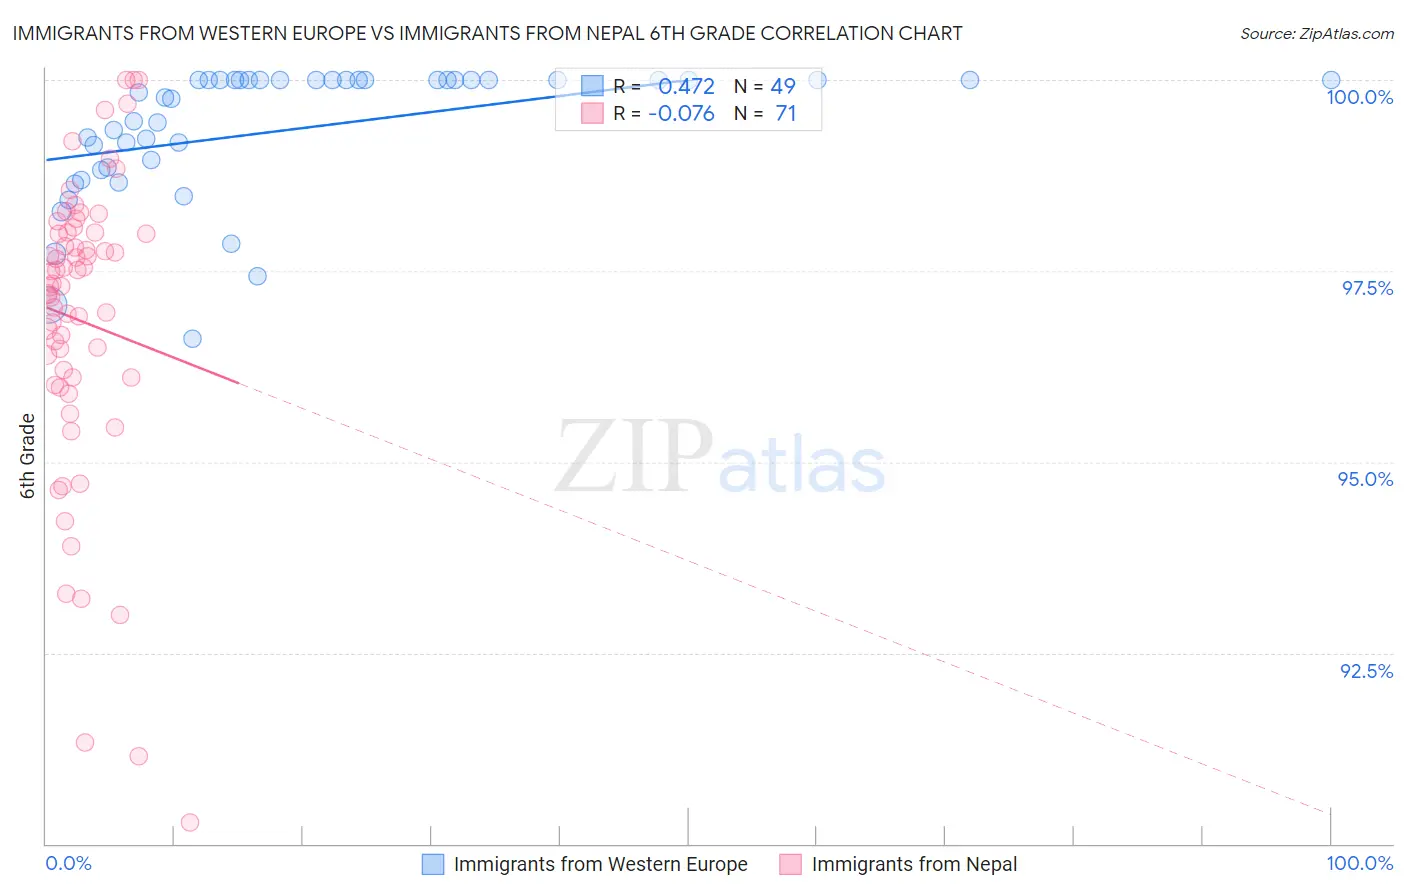
Immigrants from Western Europe vs Immigrants from Nepal 6th Grade Correlation Chart
The statistical analysis conducted on geographies consisting of 494,080,297 people shows a moderate positive correlation between the proportion of Immigrants from Western Europe and percentage of population with at least 6th grade education in the United States with a correlation coefficient (R) of 0.472 and weighted average of 97.5%. Similarly, the statistical analysis conducted on geographies consisting of 186,739,570 people shows a slight negative correlation between the proportion of Immigrants from Nepal and percentage of population with at least 6th grade education in the United States with a correlation coefficient (R) of -0.076 and weighted average of 96.8%, a difference of 0.75%.
6th Grade Correlation Summary
| Measurement | Immigrants from Western Europe | Immigrants from Nepal |
| Minimum | 96.6% | 90.3% |
| Maximum | 100.0% | 100.0% |
| Range | 3.4% | 9.7% |
| Mean | 99.3% | 96.8% |
| Median | 99.8% | 97.3% |
| Interquartile 25% (IQ1) | 98.8% | 96.1% |
| Interquartile 75% (IQ3) | 100.0% | 98.0% |
| Interquartile Range (IQR) | 1.2% | 1.9% |
| Standard Deviation (Sample) | 0.88% | 2.0% |
| Standard Deviation (Population) | 0.87% | 2.0% |
Similar Demographics by 6th Grade
Demographics Similar to Immigrants from Western Europe by 6th Grade
In terms of 6th grade, the demographic groups most similar to Immigrants from Western Europe are Pueblo (97.5%, a difference of 0.0%), Immigrants from Belgium (97.5%, a difference of 0.010%), Puget Sound Salish (97.5%, a difference of 0.010%), Immigrants from South Africa (97.5%, a difference of 0.010%), and Immigrants from Australia (97.5%, a difference of 0.010%).
| Demographics | Rating | Rank | 6th Grade |
| Shoshone | 99.0 /100 | #84 | Exceptional 97.6% |
| Delaware | 98.9 /100 | #85 | Exceptional 97.6% |
| Immigrants | Belgium | 98.9 /100 | #86 | Exceptional 97.5% |
| Puget Sound Salish | 98.9 /100 | #87 | Exceptional 97.5% |
| Immigrants | South Africa | 98.9 /100 | #88 | Exceptional 97.5% |
| Immigrants | Australia | 98.8 /100 | #89 | Exceptional 97.5% |
| Pueblo | 98.8 /100 | #90 | Exceptional 97.5% |
| Immigrants | Western Europe | 98.8 /100 | #91 | Exceptional 97.5% |
| Romanians | 98.7 /100 | #92 | Exceptional 97.5% |
| Cree | 98.7 /100 | #93 | Exceptional 97.5% |
| Cypriots | 98.7 /100 | #94 | Exceptional 97.5% |
| Immigrants | Ireland | 98.7 /100 | #95 | Exceptional 97.5% |
| Immigrants | Germany | 98.6 /100 | #96 | Exceptional 97.5% |
| Immigrants | Sweden | 98.6 /100 | #97 | Exceptional 97.5% |
| Immigrants | Denmark | 98.5 /100 | #98 | Exceptional 97.5% |
Demographics Similar to Immigrants from Nepal by 6th Grade
In terms of 6th grade, the demographic groups most similar to Immigrants from Nepal are Samoan (96.8%, a difference of 0.010%), Immigrants from Oceania (96.8%, a difference of 0.010%), Immigrants from Iraq (96.8%, a difference of 0.010%), Laotian (96.8%, a difference of 0.020%), and Iraqi (96.8%, a difference of 0.020%).
| Demographics | Rating | Rank | 6th Grade |
| Sudanese | 13.9 /100 | #203 | Poor 96.8% |
| Immigrants | Bahamas | 13.8 /100 | #204 | Poor 96.8% |
| Natives/Alaskans | 13.0 /100 | #205 | Poor 96.8% |
| Laotians | 11.8 /100 | #206 | Poor 96.8% |
| Iraqis | 11.7 /100 | #207 | Poor 96.8% |
| Samoans | 11.0 /100 | #208 | Poor 96.8% |
| Immigrants | Oceania | 11.0 /100 | #209 | Poor 96.8% |
| Immigrants | Nepal | 10.1 /100 | #210 | Poor 96.8% |
| Immigrants | Iraq | 9.2 /100 | #211 | Tragic 96.8% |
| Moroccans | 9.0 /100 | #212 | Tragic 96.8% |
| Immigrants | Sudan | 8.7 /100 | #213 | Tragic 96.8% |
| Portuguese | 8.2 /100 | #214 | Tragic 96.8% |
| Sierra Leoneans | 8.0 /100 | #215 | Tragic 96.8% |
| Paiute | 7.8 /100 | #216 | Tragic 96.8% |
| Liberians | 7.5 /100 | #217 | Tragic 96.8% |