Immigrants from Western Europe vs Immigrants from Eastern Europe No Schooling Completed
COMPARE
Immigrants from Western Europe
Immigrants from Eastern Europe
No Schooling Completed
No Schooling Completed Comparison
Immigrants from Western Europe
Immigrants from Eastern Europe
1.8%
NO SCHOOLING COMPLETED
99.2/ 100
METRIC RATING
88th/ 347
METRIC RANK
2.0%
NO SCHOOLING COMPLETED
70.4/ 100
METRIC RATING
152nd/ 347
METRIC RANK
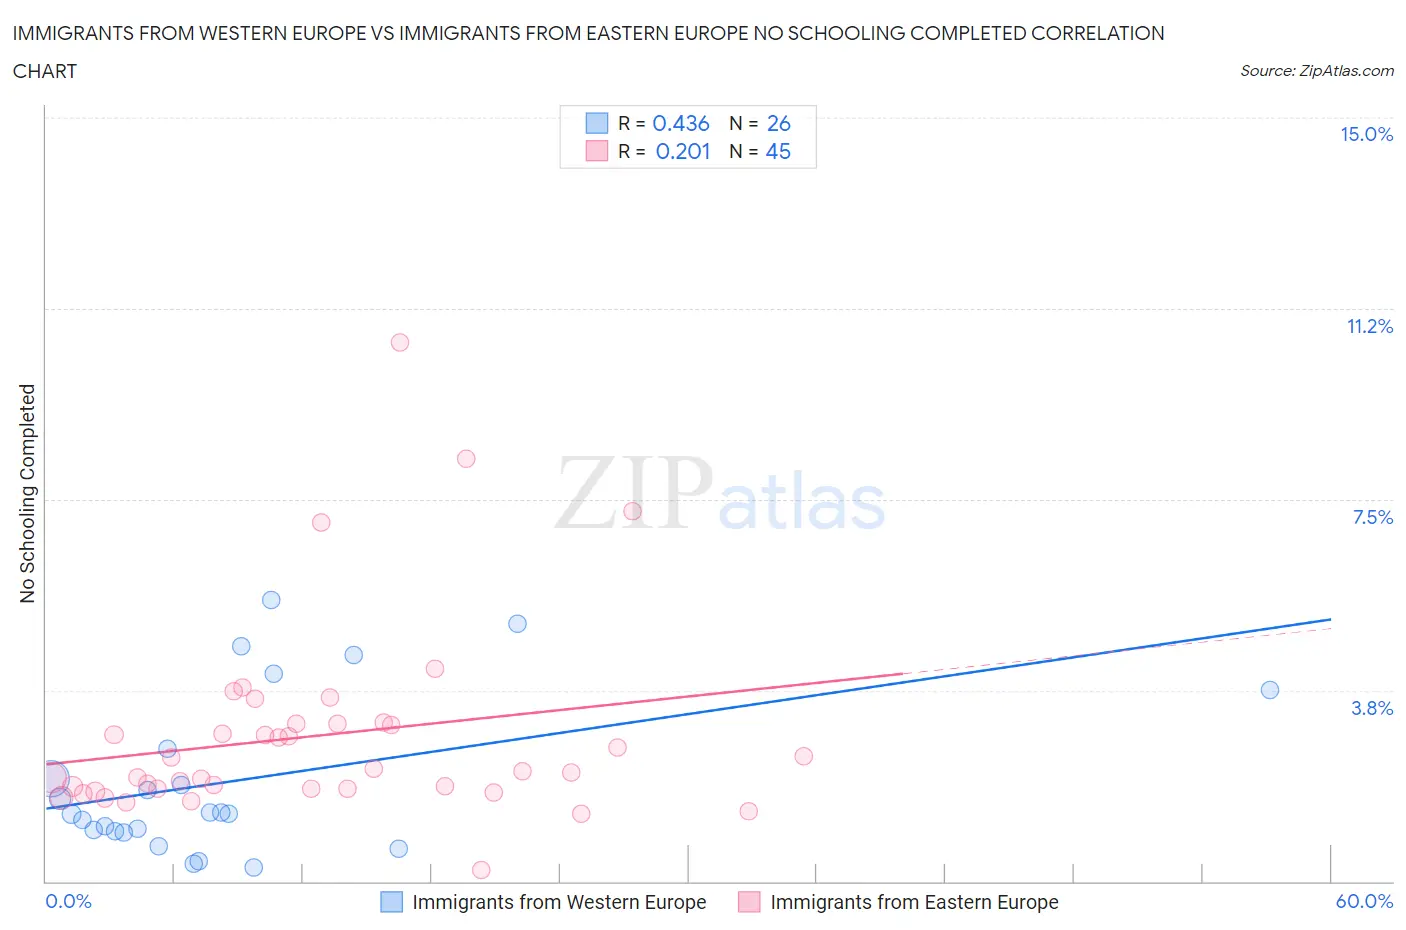
Immigrants from Western Europe vs Immigrants from Eastern Europe No Schooling Completed Correlation Chart
The statistical analysis conducted on geographies consisting of 485,224,363 people shows a moderate positive correlation between the proportion of Immigrants from Western Europe and percentage of population with no schooling in the United States with a correlation coefficient (R) of 0.436 and weighted average of 1.8%. Similarly, the statistical analysis conducted on geographies consisting of 467,799,088 people shows a weak positive correlation between the proportion of Immigrants from Eastern Europe and percentage of population with no schooling in the United States with a correlation coefficient (R) of 0.201 and weighted average of 2.0%, a difference of 15.6%.
No Schooling Completed Correlation Summary
| Measurement | Immigrants from Western Europe | Immigrants from Eastern Europe |
| Minimum | 0.27% | 0.21% |
| Maximum | 5.5% | 10.6% |
| Range | 5.3% | 10.4% |
| Mean | 2.0% | 2.9% |
| Median | 1.3% | 2.2% |
| Interquartile 25% (IQ1) | 0.98% | 1.8% |
| Interquartile 75% (IQ3) | 2.6% | 3.1% |
| Interquartile Range (IQR) | 1.6% | 1.3% |
| Standard Deviation (Sample) | 1.6% | 1.9% |
| Standard Deviation (Population) | 1.5% | 1.9% |
Similar Demographics by No Schooling Completed
Demographics Similar to Immigrants from Western Europe by No Schooling Completed
In terms of no schooling completed, the demographic groups most similar to Immigrants from Western Europe are Osage (1.8%, a difference of 0.040%), South African (1.8%, a difference of 0.040%), Ukrainian (1.8%, a difference of 0.36%), Immigrants from Australia (1.7%, a difference of 0.40%), and Immigrants from Denmark (1.7%, a difference of 0.44%).
| Demographics | Rating | Rank | No Schooling Completed |
| Icelanders | 99.3 /100 | #81 | Exceptional 1.7% |
| Immigrants | South Africa | 99.3 /100 | #82 | Exceptional 1.7% |
| Potawatomi | 99.3 /100 | #83 | Exceptional 1.7% |
| Immigrants | Denmark | 99.2 /100 | #84 | Exceptional 1.7% |
| Immigrants | Australia | 99.2 /100 | #85 | Exceptional 1.7% |
| Ukrainians | 99.2 /100 | #86 | Exceptional 1.8% |
| Osage | 99.2 /100 | #87 | Exceptional 1.8% |
| Immigrants | Western Europe | 99.2 /100 | #88 | Exceptional 1.8% |
| South Africans | 99.1 /100 | #89 | Exceptional 1.8% |
| Sioux | 99.0 /100 | #90 | Exceptional 1.8% |
| Immigrants | Germany | 99.0 /100 | #91 | Exceptional 1.8% |
| Romanians | 98.8 /100 | #92 | Exceptional 1.8% |
| Turks | 98.7 /100 | #93 | Exceptional 1.8% |
| Immigrants | Nonimmigrants | 98.5 /100 | #94 | Exceptional 1.8% |
| Puget Sound Salish | 98.5 /100 | #95 | Exceptional 1.8% |
Demographics Similar to Immigrants from Eastern Europe by No Schooling Completed
In terms of no schooling completed, the demographic groups most similar to Immigrants from Eastern Europe are Immigrants from Jordan (2.0%, a difference of 0.090%), Immigrants from Italy (2.0%, a difference of 0.24%), Immigrants from Venezuela (2.0%, a difference of 0.30%), Blackfeet (2.0%, a difference of 0.43%), and Immigrants from Russia (2.0%, a difference of 0.44%).
| Demographics | Rating | Rank | No Schooling Completed |
| Immigrants | Iran | 79.0 /100 | #145 | Good 2.0% |
| Immigrants | Moldova | 78.0 /100 | #146 | Good 2.0% |
| Soviet Union | 77.1 /100 | #147 | Good 2.0% |
| Shoshone | 76.7 /100 | #148 | Good 2.0% |
| Immigrants | North Macedonia | 75.9 /100 | #149 | Good 2.0% |
| Blackfeet | 72.9 /100 | #150 | Good 2.0% |
| Immigrants | Jordan | 70.9 /100 | #151 | Good 2.0% |
| Immigrants | Eastern Europe | 70.4 /100 | #152 | Good 2.0% |
| Immigrants | Italy | 68.9 /100 | #153 | Good 2.0% |
| Immigrants | Venezuela | 68.5 /100 | #154 | Good 2.0% |
| Immigrants | Russia | 67.6 /100 | #155 | Good 2.0% |
| Chileans | 67.2 /100 | #156 | Good 2.0% |
| Immigrants | Sri Lanka | 67.0 /100 | #157 | Good 2.0% |
| Immigrants | Korea | 66.7 /100 | #158 | Good 2.0% |
| Immigrants | Spain | 66.4 /100 | #159 | Good 2.0% |