Immigrants from Western Europe vs Cape Verdean Associate's Degree
COMPARE
Immigrants from Western Europe
Cape Verdean
Associate's Degree
Associate's Degree Comparison
Immigrants from Western Europe
Cape Verdeans
50.1%
ASSOCIATE'S DEGREE
98.7/ 100
METRIC RATING
89th/ 347
METRIC RANK
38.8%
ASSOCIATE'S DEGREE
0.0/ 100
METRIC RATING
297th/ 347
METRIC RANK
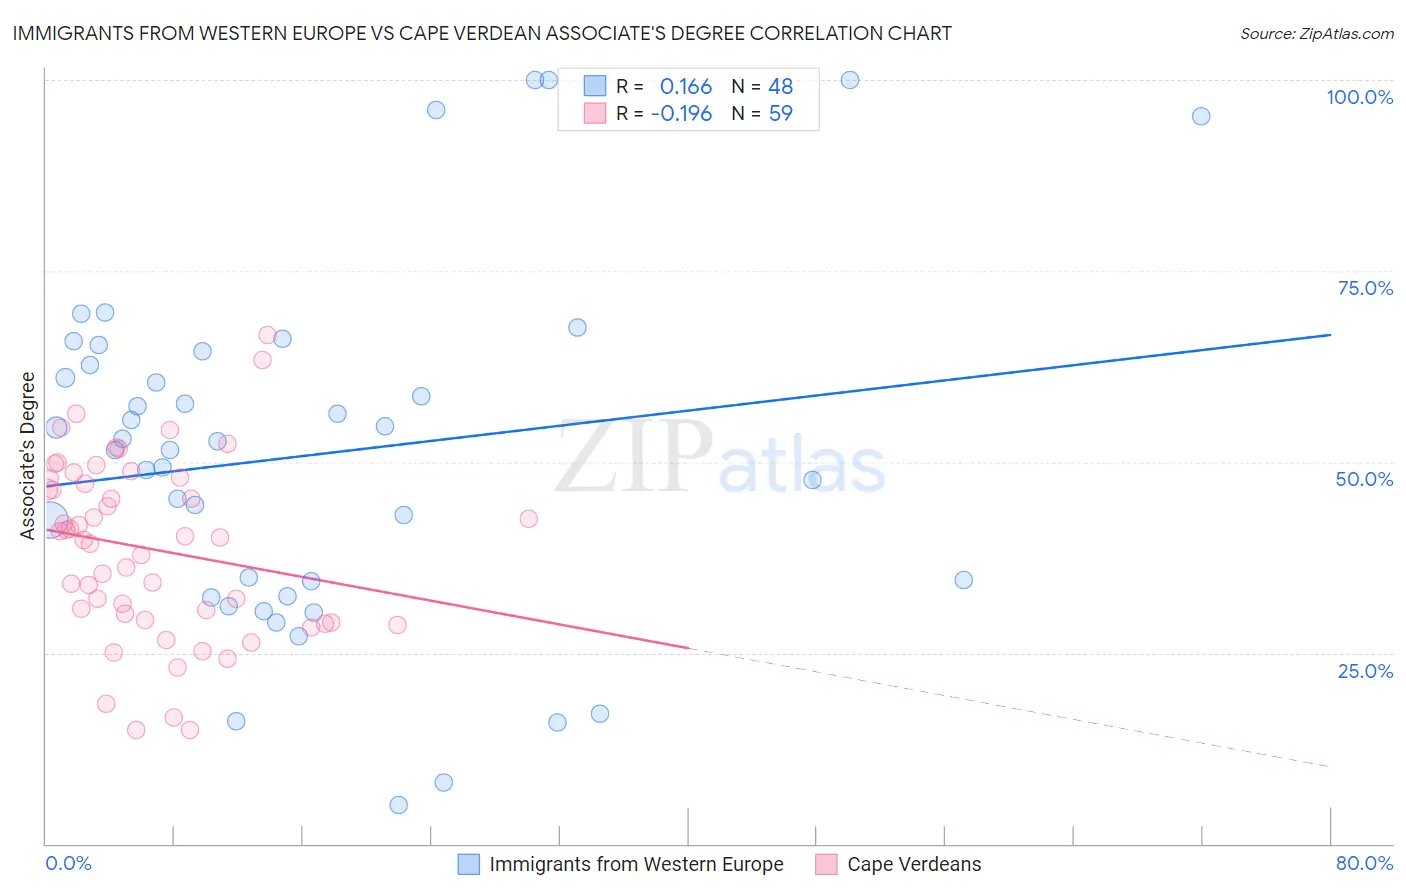
Immigrants from Western Europe vs Cape Verdean Associate's Degree Correlation Chart
The statistical analysis conducted on geographies consisting of 494,061,937 people shows a poor positive correlation between the proportion of Immigrants from Western Europe and percentage of population with at least associate's degree education in the United States with a correlation coefficient (R) of 0.166 and weighted average of 50.1%. Similarly, the statistical analysis conducted on geographies consisting of 107,580,652 people shows a poor negative correlation between the proportion of Cape Verdeans and percentage of population with at least associate's degree education in the United States with a correlation coefficient (R) of -0.196 and weighted average of 38.8%, a difference of 29.3%.
Associate's Degree Correlation Summary
| Measurement | Immigrants from Western Europe | Cape Verdean |
| Minimum | 5.1% | 14.9% |
| Maximum | 100.0% | 66.6% |
| Range | 94.9% | 51.7% |
| Mean | 51.0% | 38.6% |
| Median | 52.2% | 40.1% |
| Interquartile 25% (IQ1) | 33.4% | 29.3% |
| Interquartile 75% (IQ3) | 63.5% | 47.9% |
| Interquartile Range (IQR) | 30.1% | 18.6% |
| Standard Deviation (Sample) | 23.1% | 11.7% |
| Standard Deviation (Population) | 22.9% | 11.6% |
Similar Demographics by Associate's Degree
Demographics Similar to Immigrants from Western Europe by Associate's Degree
In terms of associate's degree, the demographic groups most similar to Immigrants from Western Europe are Immigrants from Canada (50.1%, a difference of 0.010%), Immigrants from Ethiopia (50.1%, a difference of 0.010%), Immigrants from Moldova (50.2%, a difference of 0.080%), Immigrants from Western Asia (50.1%, a difference of 0.080%), and Immigrants from North America (50.1%, a difference of 0.11%).
| Demographics | Rating | Rank | Associate's Degree |
| Greeks | 98.9 /100 | #82 | Exceptional 50.3% |
| Immigrants | Uzbekistan | 98.9 /100 | #83 | Exceptional 50.3% |
| Immigrants | Hungary | 98.9 /100 | #84 | Exceptional 50.2% |
| Immigrants | Egypt | 98.9 /100 | #85 | Exceptional 50.2% |
| Immigrants | Croatia | 98.9 /100 | #86 | Exceptional 50.2% |
| Immigrants | Moldova | 98.8 /100 | #87 | Exceptional 50.2% |
| Immigrants | Canada | 98.7 /100 | #88 | Exceptional 50.1% |
| Immigrants | Western Europe | 98.7 /100 | #89 | Exceptional 50.1% |
| Immigrants | Ethiopia | 98.7 /100 | #90 | Exceptional 50.1% |
| Immigrants | Western Asia | 98.7 /100 | #91 | Exceptional 50.1% |
| Immigrants | North America | 98.7 /100 | #92 | Exceptional 50.1% |
| Immigrants | Brazil | 98.5 /100 | #93 | Exceptional 50.0% |
| Laotians | 98.4 /100 | #94 | Exceptional 49.9% |
| Immigrants | England | 98.0 /100 | #95 | Exceptional 49.7% |
| Romanians | 98.0 /100 | #96 | Exceptional 49.7% |
Demographics Similar to Cape Verdeans by Associate's Degree
In terms of associate's degree, the demographic groups most similar to Cape Verdeans are Cheyenne (38.7%, a difference of 0.26%), Cherokee (38.9%, a difference of 0.28%), Ute (38.6%, a difference of 0.36%), Chickasaw (38.6%, a difference of 0.40%), and Honduran (38.9%, a difference of 0.45%).
| Demographics | Rating | Rank | Associate's Degree |
| Immigrants | Haiti | 0.0 /100 | #290 | Tragic 39.3% |
| Dominicans | 0.0 /100 | #291 | Tragic 39.3% |
| Blacks/African Americans | 0.0 /100 | #292 | Tragic 39.1% |
| Nepalese | 0.0 /100 | #293 | Tragic 39.0% |
| Salvadorans | 0.0 /100 | #294 | Tragic 39.0% |
| Hondurans | 0.0 /100 | #295 | Tragic 38.9% |
| Cherokee | 0.0 /100 | #296 | Tragic 38.9% |
| Cape Verdeans | 0.0 /100 | #297 | Tragic 38.8% |
| Cheyenne | 0.0 /100 | #298 | Tragic 38.7% |
| Ute | 0.0 /100 | #299 | Tragic 38.6% |
| Chickasaw | 0.0 /100 | #300 | Tragic 38.6% |
| Tsimshian | 0.0 /100 | #301 | Tragic 38.6% |
| Colville | 0.0 /100 | #302 | Tragic 38.5% |
| Guatemalans | 0.0 /100 | #303 | Tragic 38.5% |
| Sioux | 0.0 /100 | #304 | Tragic 38.5% |