Immigrants from Western Europe vs Aleut 8th Grade
COMPARE
Immigrants from Western Europe
Aleut
8th Grade
8th Grade Comparison
Immigrants from Western Europe
Aleuts
96.4%
8TH GRADE
99.0/ 100
METRIC RATING
88th/ 347
METRIC RANK
96.9%
8TH GRADE
99.9/ 100
METRIC RATING
43rd/ 347
METRIC RANK
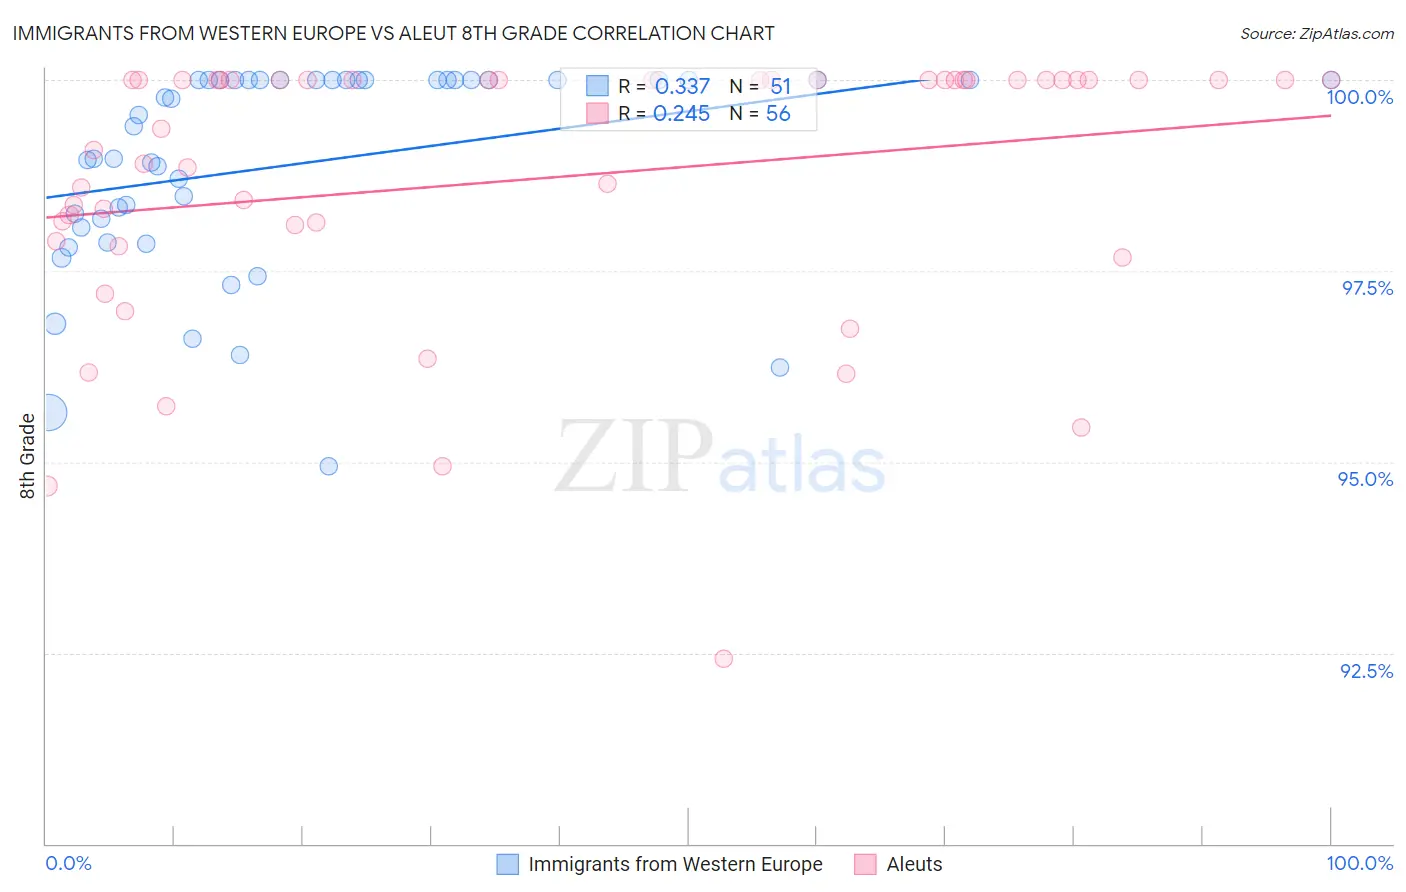
Immigrants from Western Europe vs Aleut 8th Grade Correlation Chart
The statistical analysis conducted on geographies consisting of 494,080,521 people shows a mild positive correlation between the proportion of Immigrants from Western Europe and percentage of population with at least 8th grade education in the United States with a correlation coefficient (R) of 0.337 and weighted average of 96.4%. Similarly, the statistical analysis conducted on geographies consisting of 61,780,964 people shows a weak positive correlation between the proportion of Aleuts and percentage of population with at least 8th grade education in the United States with a correlation coefficient (R) of 0.245 and weighted average of 96.9%, a difference of 0.46%.
8th Grade Correlation Summary
| Measurement | Immigrants from Western Europe | Aleut |
| Minimum | 94.9% | 92.4% |
| Maximum | 100.0% | 100.0% |
| Range | 5.1% | 7.6% |
| Mean | 98.9% | 98.7% |
| Median | 99.5% | 100.0% |
| Interquartile 25% (IQ1) | 98.1% | 98.0% |
| Interquartile 75% (IQ3) | 100.0% | 100.0% |
| Interquartile Range (IQR) | 1.9% | 2.0% |
| Standard Deviation (Sample) | 1.4% | 1.8% |
| Standard Deviation (Population) | 1.3% | 1.7% |
Similar Demographics by 8th Grade
Demographics Similar to Immigrants from Western Europe by 8th Grade
In terms of 8th grade, the demographic groups most similar to Immigrants from Western Europe are Cherokee (96.5%, a difference of 0.010%), Immigrants from Australia (96.5%, a difference of 0.010%), Chickasaw (96.4%, a difference of 0.010%), Immigrants from South Africa (96.5%, a difference of 0.020%), and Immigrants from Sweden (96.4%, a difference of 0.020%).
| Demographics | Rating | Rank | 8th Grade |
| Romanians | 99.2 /100 | #81 | Exceptional 96.5% |
| Turks | 99.2 /100 | #82 | Exceptional 96.5% |
| Icelanders | 99.2 /100 | #83 | Exceptional 96.5% |
| Immigrants | Belgium | 99.1 /100 | #84 | Exceptional 96.5% |
| Immigrants | South Africa | 99.1 /100 | #85 | Exceptional 96.5% |
| Cherokee | 99.0 /100 | #86 | Exceptional 96.5% |
| Immigrants | Australia | 99.0 /100 | #87 | Exceptional 96.5% |
| Immigrants | Western Europe | 99.0 /100 | #88 | Exceptional 96.4% |
| Chickasaw | 98.9 /100 | #89 | Exceptional 96.4% |
| Immigrants | Sweden | 98.9 /100 | #90 | Exceptional 96.4% |
| Thais | 98.9 /100 | #91 | Exceptional 96.4% |
| Menominee | 98.9 /100 | #92 | Exceptional 96.4% |
| Immigrants | Denmark | 98.8 /100 | #93 | Exceptional 96.4% |
| Immigrants | Singapore | 98.8 /100 | #94 | Exceptional 96.4% |
| German Russians | 98.8 /100 | #95 | Exceptional 96.4% |
Demographics Similar to Aleuts by 8th Grade
In terms of 8th grade, the demographic groups most similar to Aleuts are Maltese (96.9%, a difference of 0.020%), Northern European (96.9%, a difference of 0.020%), Chinese (96.9%, a difference of 0.030%), Czechoslovakian (96.9%, a difference of 0.030%), and Bulgarian (96.9%, a difference of 0.040%).
| Demographics | Rating | Rank | 8th Grade |
| Belgians | 100.0 /100 | #36 | Exceptional 97.0% |
| Latvians | 100.0 /100 | #37 | Exceptional 97.0% |
| British | 100.0 /100 | #38 | Exceptional 97.0% |
| Hungarians | 100.0 /100 | #39 | Exceptional 97.0% |
| Inupiat | 100.0 /100 | #40 | Exceptional 97.0% |
| Eastern Europeans | 100.0 /100 | #41 | Exceptional 97.0% |
| Chinese | 100.0 /100 | #42 | Exceptional 96.9% |
| Aleuts | 99.9 /100 | #43 | Exceptional 96.9% |
| Maltese | 99.9 /100 | #44 | Exceptional 96.9% |
| Northern Europeans | 99.9 /100 | #45 | Exceptional 96.9% |
| Czechoslovakians | 99.9 /100 | #46 | Exceptional 96.9% |
| Bulgarians | 99.9 /100 | #47 | Exceptional 96.9% |
| Slavs | 99.9 /100 | #48 | Exceptional 96.8% |
| Estonians | 99.9 /100 | #49 | Exceptional 96.8% |
| Immigrants | Scotland | 99.9 /100 | #50 | Exceptional 96.8% |