Immigrants from Western Asia vs Japanese Doctorate Degree
COMPARE
Immigrants from Western Asia
Japanese
Doctorate Degree
Doctorate Degree Comparison
Immigrants from Western Asia
Japanese
2.2%
DOCTORATE DEGREE
99.8/ 100
METRIC RATING
75th/ 347
METRIC RANK
1.5%
DOCTORATE DEGREE
0.9/ 100
METRIC RATING
260th/ 347
METRIC RANK
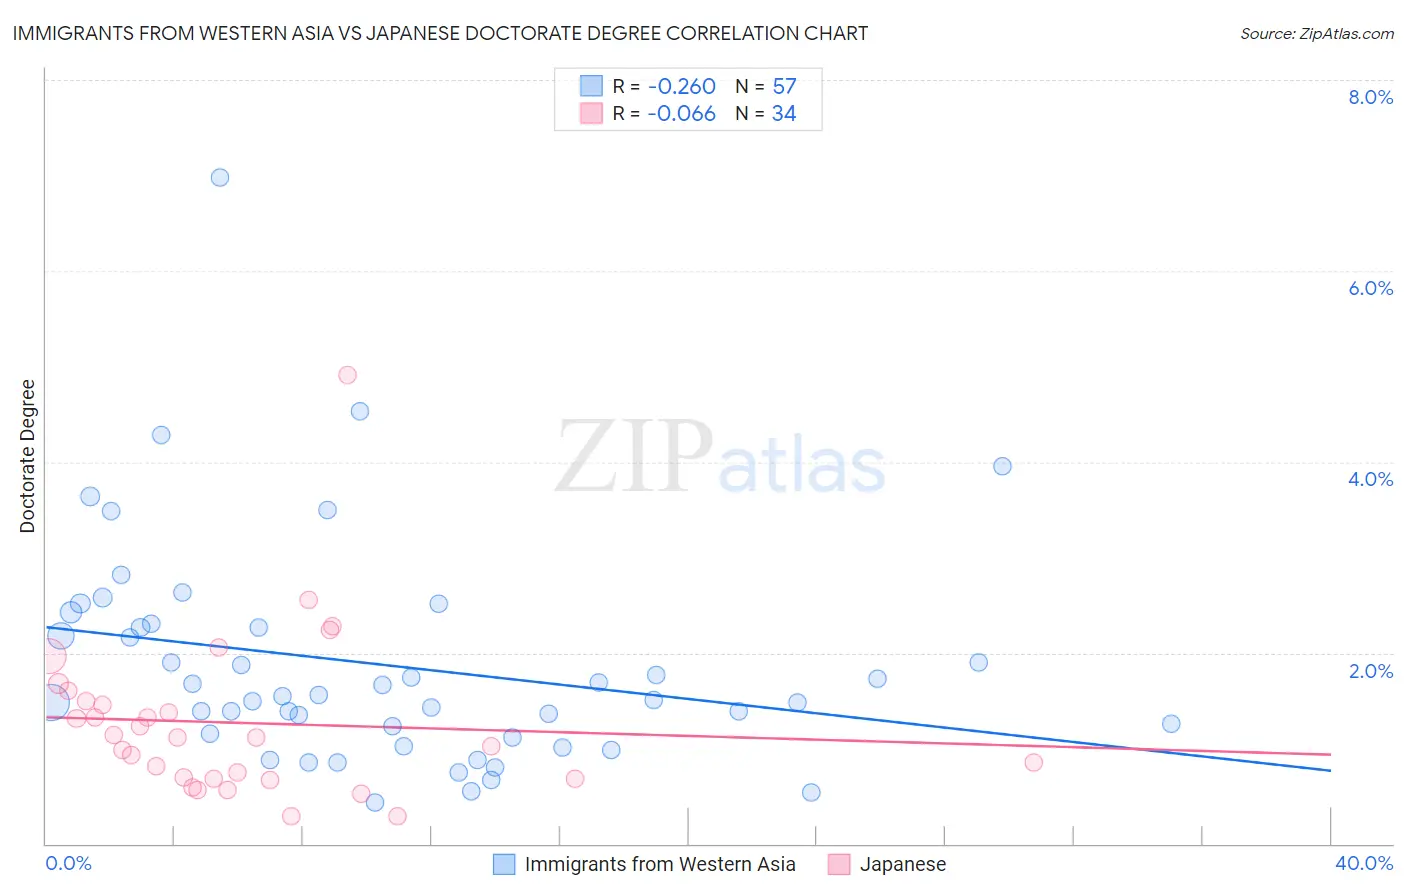
Immigrants from Western Asia vs Japanese Doctorate Degree Correlation Chart
The statistical analysis conducted on geographies consisting of 401,633,885 people shows a weak negative correlation between the proportion of Immigrants from Western Asia and percentage of population with at least doctorate degree education in the United States with a correlation coefficient (R) of -0.260 and weighted average of 2.2%. Similarly, the statistical analysis conducted on geographies consisting of 247,895,827 people shows a slight negative correlation between the proportion of Japanese and percentage of population with at least doctorate degree education in the United States with a correlation coefficient (R) of -0.066 and weighted average of 1.5%, a difference of 48.0%.
Doctorate Degree Correlation Summary
| Measurement | Immigrants from Western Asia | Japanese |
| Minimum | 0.43% | 0.29% |
| Maximum | 7.0% | 4.9% |
| Range | 6.5% | 4.6% |
| Mean | 1.9% | 1.3% |
| Median | 1.6% | 1.1% |
| Interquartile 25% (IQ1) | 1.1% | 0.69% |
| Interquartile 75% (IQ3) | 2.3% | 1.5% |
| Interquartile Range (IQR) | 1.2% | 0.80% |
| Standard Deviation (Sample) | 1.2% | 0.87% |
| Standard Deviation (Population) | 1.2% | 0.85% |
Similar Demographics by Doctorate Degree
Demographics Similar to Immigrants from Western Asia by Doctorate Degree
In terms of doctorate degree, the demographic groups most similar to Immigrants from Western Asia are Immigrants from Hungary (2.2%, a difference of 0.070%), Immigrants from Lebanon (2.2%, a difference of 0.080%), Immigrants from North America (2.2%, a difference of 0.10%), Immigrants from Bulgaria (2.3%, a difference of 0.24%), and Immigrants from Canada (2.3%, a difference of 0.32%).
| Demographics | Rating | Rank | Doctorate Degree |
| Immigrants | Kazakhstan | 99.8 /100 | #68 | Exceptional 2.3% |
| Carpatho Rusyns | 99.8 /100 | #69 | Exceptional 2.3% |
| Lithuanians | 99.8 /100 | #70 | Exceptional 2.3% |
| Immigrants | Bolivia | 99.8 /100 | #71 | Exceptional 2.3% |
| Immigrants | Canada | 99.8 /100 | #72 | Exceptional 2.3% |
| Immigrants | Bulgaria | 99.8 /100 | #73 | Exceptional 2.3% |
| Immigrants | North America | 99.8 /100 | #74 | Exceptional 2.2% |
| Immigrants | Western Asia | 99.8 /100 | #75 | Exceptional 2.2% |
| Immigrants | Hungary | 99.8 /100 | #76 | Exceptional 2.2% |
| Immigrants | Lebanon | 99.8 /100 | #77 | Exceptional 2.2% |
| Immigrants | Belarus | 99.7 /100 | #78 | Exceptional 2.2% |
| Northern Europeans | 99.7 /100 | #79 | Exceptional 2.2% |
| Ugandans | 99.7 /100 | #80 | Exceptional 2.2% |
| Immigrants | Argentina | 99.7 /100 | #81 | Exceptional 2.2% |
| Immigrants | Uganda | 99.6 /100 | #82 | Exceptional 2.2% |
Demographics Similar to Japanese by Doctorate Degree
In terms of doctorate degree, the demographic groups most similar to Japanese are Liberian (1.5%, a difference of 0.10%), Immigrants from West Indies (1.5%, a difference of 0.12%), Chippewa (1.5%, a difference of 0.38%), Immigrants from Portugal (1.5%, a difference of 0.46%), and Central American Indian (1.5%, a difference of 0.60%).
| Demographics | Rating | Rank | Doctorate Degree |
| Americans | 1.0 /100 | #253 | Tragic 1.5% |
| Immigrants | Cambodia | 1.0 /100 | #254 | Tragic 1.5% |
| Trinidadians and Tobagonians | 1.0 /100 | #255 | Tragic 1.5% |
| Central American Indians | 1.0 /100 | #256 | Tragic 1.5% |
| Chippewa | 0.9 /100 | #257 | Tragic 1.5% |
| Immigrants | West Indies | 0.9 /100 | #258 | Tragic 1.5% |
| Liberians | 0.9 /100 | #259 | Tragic 1.5% |
| Japanese | 0.9 /100 | #260 | Tragic 1.5% |
| Immigrants | Portugal | 0.8 /100 | #261 | Tragic 1.5% |
| Chickasaw | 0.7 /100 | #262 | Tragic 1.5% |
| Immigrants | Bahamas | 0.7 /100 | #263 | Tragic 1.5% |
| Blackfeet | 0.7 /100 | #264 | Tragic 1.5% |
| Nicaraguans | 0.6 /100 | #265 | Tragic 1.5% |
| Immigrants | Liberia | 0.5 /100 | #266 | Tragic 1.5% |
| Kiowa | 0.5 /100 | #267 | Tragic 1.5% |