Immigrants from Western Asia vs Immigrants from Caribbean Professional Degree
COMPARE
Immigrants from Western Asia
Immigrants from Caribbean
Professional Degree
Professional Degree Comparison
Immigrants from Western Asia
Immigrants from Caribbean
5.4%
PROFESSIONAL DEGREE
99.8/ 100
METRIC RATING
71st/ 347
METRIC RANK
3.5%
PROFESSIONAL DEGREE
0.5/ 100
METRIC RATING
282nd/ 347
METRIC RANK
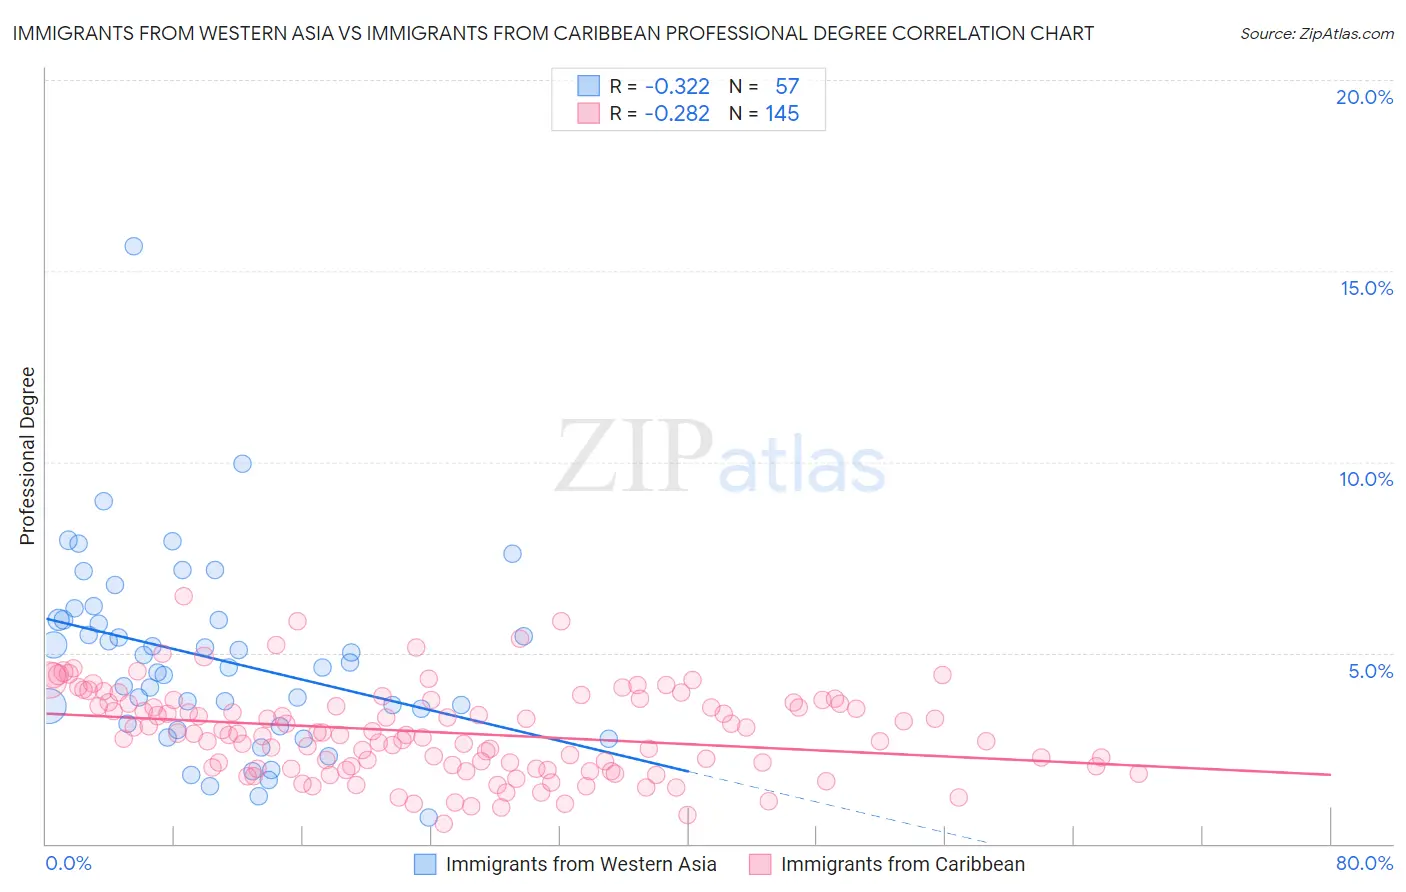
Immigrants from Western Asia vs Immigrants from Caribbean Professional Degree Correlation Chart
The statistical analysis conducted on geographies consisting of 403,868,924 people shows a mild negative correlation between the proportion of Immigrants from Western Asia and percentage of population with at least professional degree education in the United States with a correlation coefficient (R) of -0.322 and weighted average of 5.4%. Similarly, the statistical analysis conducted on geographies consisting of 448,523,190 people shows a weak negative correlation between the proportion of Immigrants from Caribbean and percentage of population with at least professional degree education in the United States with a correlation coefficient (R) of -0.282 and weighted average of 3.5%, a difference of 52.6%.
Professional Degree Correlation Summary
| Measurement | Immigrants from Western Asia | Immigrants from Caribbean |
| Minimum | 0.70% | 0.54% |
| Maximum | 15.7% | 6.5% |
| Range | 14.9% | 5.9% |
| Mean | 4.8% | 2.9% |
| Median | 4.6% | 2.9% |
| Interquartile 25% (IQ1) | 3.1% | 2.0% |
| Interquartile 75% (IQ3) | 5.9% | 3.7% |
| Interquartile Range (IQR) | 2.8% | 1.7% |
| Standard Deviation (Sample) | 2.5% | 1.2% |
| Standard Deviation (Population) | 2.5% | 1.1% |
Similar Demographics by Professional Degree
Demographics Similar to Immigrants from Western Asia by Professional Degree
In terms of professional degree, the demographic groups most similar to Immigrants from Western Asia are Lithuanian (5.4%, a difference of 0.48%), Immigrants from Romania (5.4%, a difference of 0.58%), Bhutanese (5.4%, a difference of 0.59%), Immigrants from Hungary (5.5%, a difference of 0.92%), and Ethiopian (5.4%, a difference of 0.96%).
| Demographics | Rating | Rank | Professional Degree |
| Immigrants | Asia | 99.9 /100 | #64 | Exceptional 5.5% |
| Immigrants | Bolivia | 99.9 /100 | #65 | Exceptional 5.5% |
| Immigrants | Kazakhstan | 99.9 /100 | #66 | Exceptional 5.5% |
| Immigrants | Bulgaria | 99.9 /100 | #67 | Exceptional 5.5% |
| Immigrants | Lebanon | 99.9 /100 | #68 | Exceptional 5.5% |
| Immigrants | Hungary | 99.9 /100 | #69 | Exceptional 5.5% |
| Bhutanese | 99.8 /100 | #70 | Exceptional 5.4% |
| Immigrants | Western Asia | 99.8 /100 | #71 | Exceptional 5.4% |
| Lithuanians | 99.8 /100 | #72 | Exceptional 5.4% |
| Immigrants | Romania | 99.8 /100 | #73 | Exceptional 5.4% |
| Ethiopians | 99.7 /100 | #74 | Exceptional 5.4% |
| Immigrants | Indonesia | 99.7 /100 | #75 | Exceptional 5.3% |
| Immigrants | Canada | 99.7 /100 | #76 | Exceptional 5.3% |
| Immigrants | Ethiopia | 99.7 /100 | #77 | Exceptional 5.3% |
| Armenians | 99.7 /100 | #78 | Exceptional 5.3% |
Demographics Similar to Immigrants from Caribbean by Professional Degree
In terms of professional degree, the demographic groups most similar to Immigrants from Caribbean are Apache (3.5%, a difference of 0.020%), Dominican (3.5%, a difference of 0.050%), Immigrants from Portugal (3.5%, a difference of 0.080%), Japanese (3.5%, a difference of 0.12%), and Cheyenne (3.6%, a difference of 0.18%).
| Demographics | Rating | Rank | Professional Degree |
| Immigrants | Dominica | 0.5 /100 | #275 | Tragic 3.6% |
| Liberians | 0.5 /100 | #276 | Tragic 3.6% |
| Cheyenne | 0.5 /100 | #277 | Tragic 3.6% |
| Japanese | 0.5 /100 | #278 | Tragic 3.5% |
| Immigrants | Portugal | 0.5 /100 | #279 | Tragic 3.5% |
| Dominicans | 0.5 /100 | #280 | Tragic 3.5% |
| Apache | 0.5 /100 | #281 | Tragic 3.5% |
| Immigrants | Caribbean | 0.5 /100 | #282 | Tragic 3.5% |
| Comanche | 0.4 /100 | #283 | Tragic 3.5% |
| Salvadorans | 0.4 /100 | #284 | Tragic 3.5% |
| Hondurans | 0.3 /100 | #285 | Tragic 3.5% |
| Haitians | 0.3 /100 | #286 | Tragic 3.5% |
| Immigrants | El Salvador | 0.3 /100 | #287 | Tragic 3.5% |
| Blackfeet | 0.3 /100 | #288 | Tragic 3.5% |
| Guatemalans | 0.3 /100 | #289 | Tragic 3.5% |